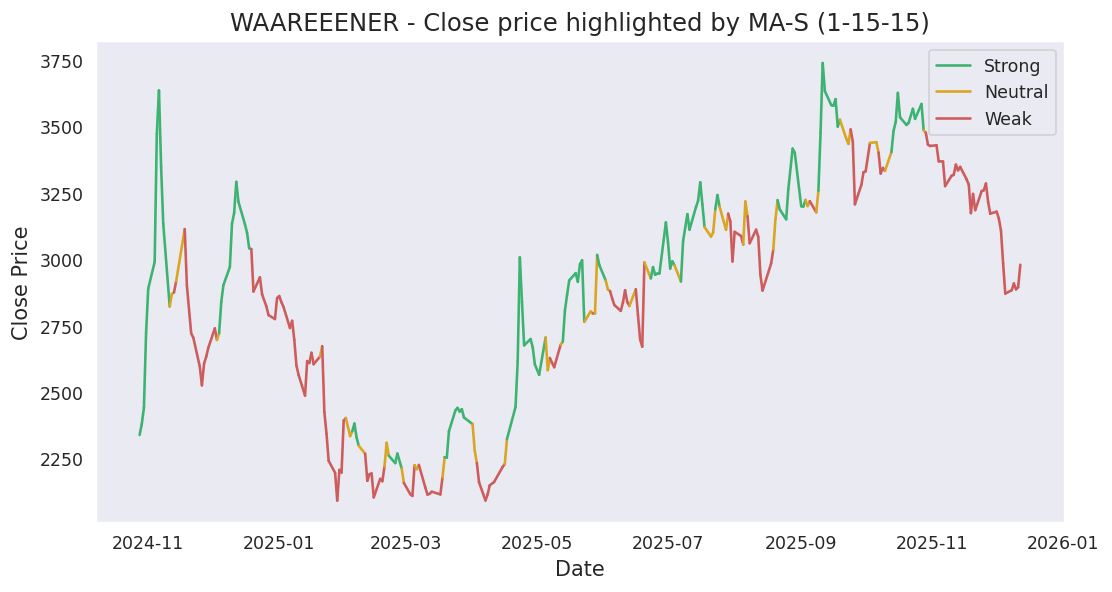
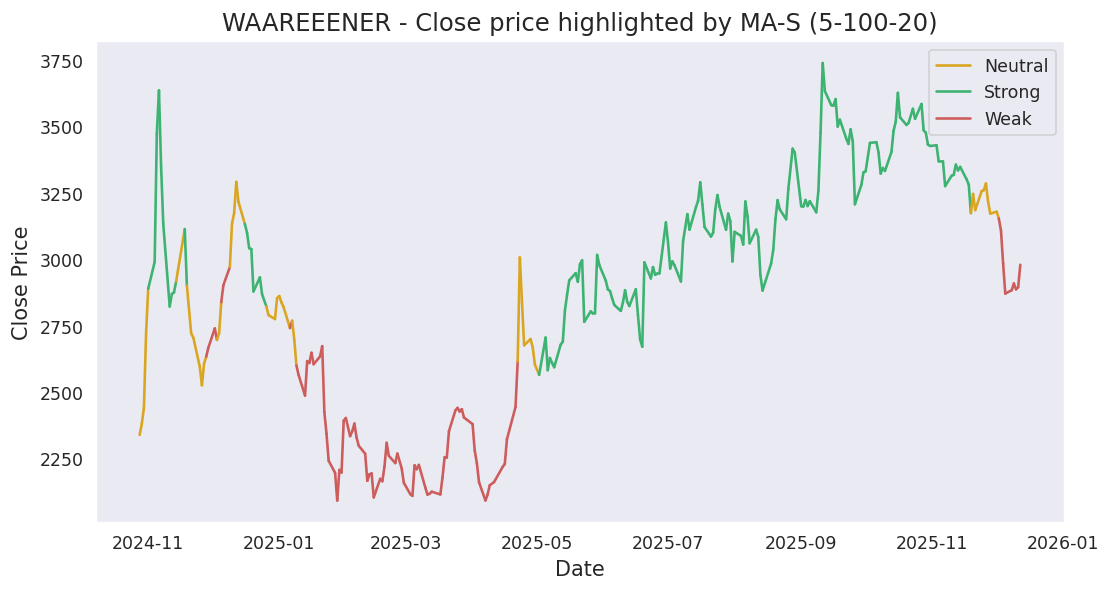
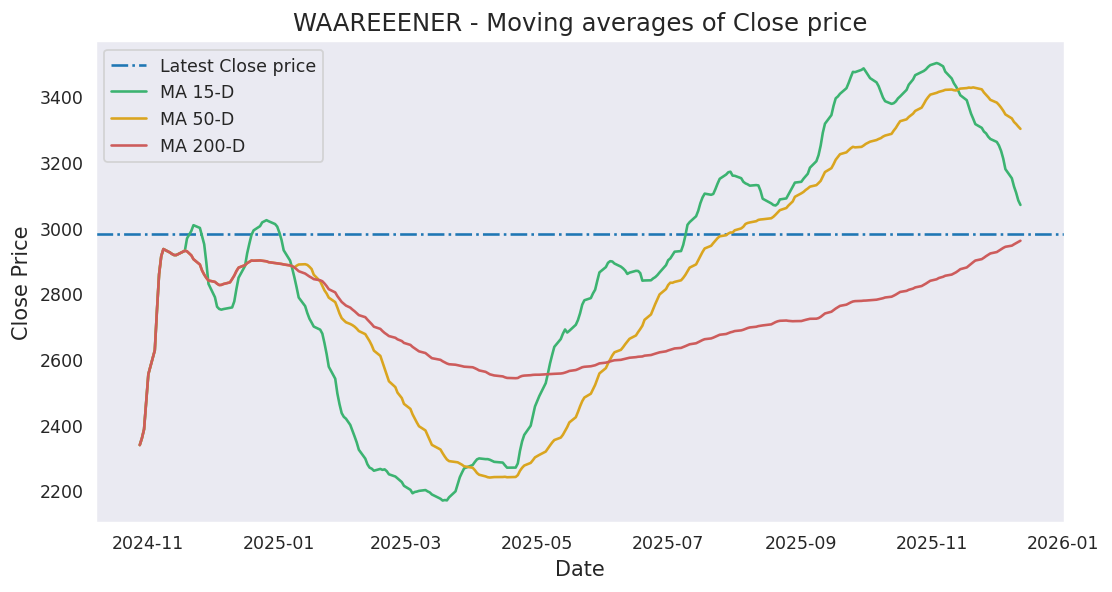
Moving averages
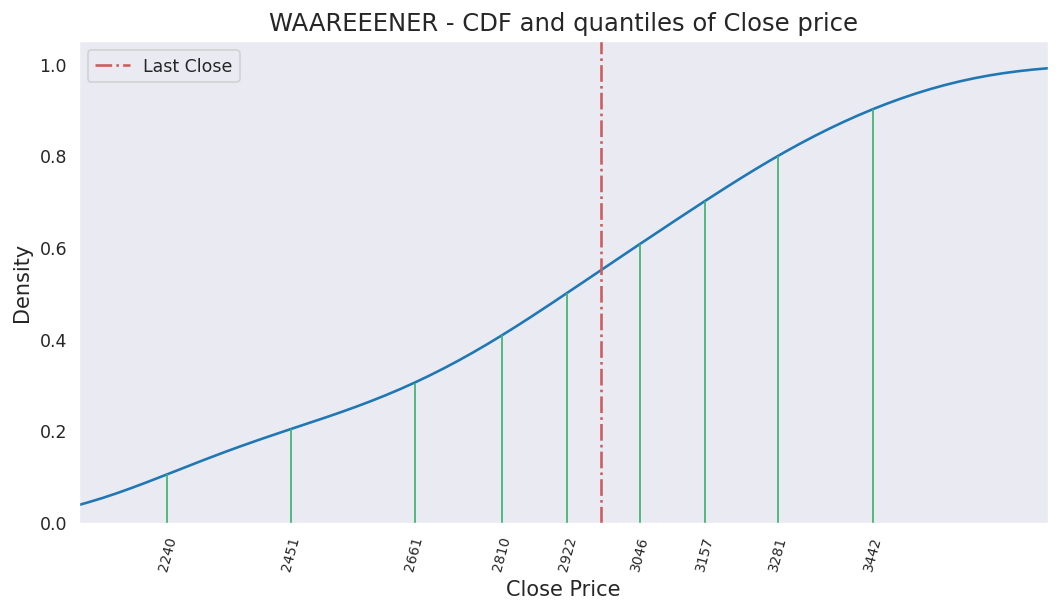
Last close price: 3125.4
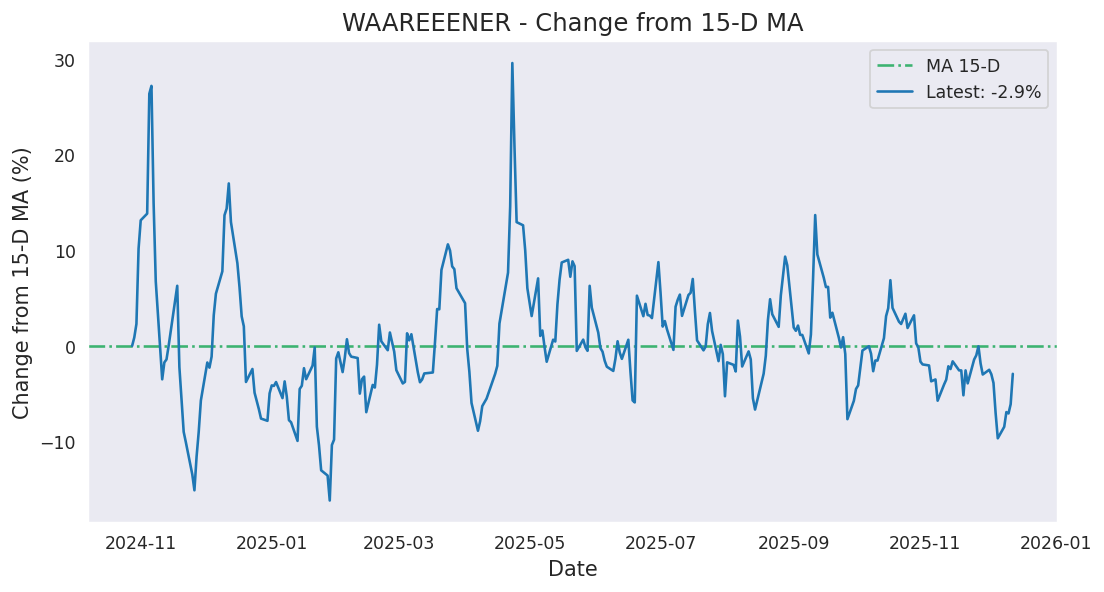
Average of last 15 days: 3059.83
Average of last 50 days: 3173.04
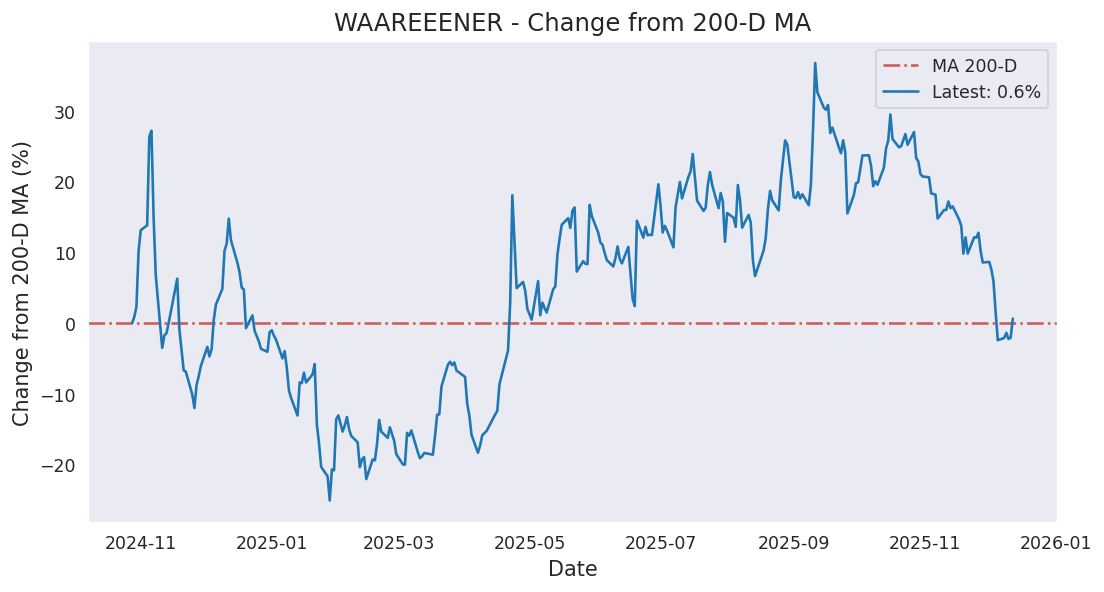
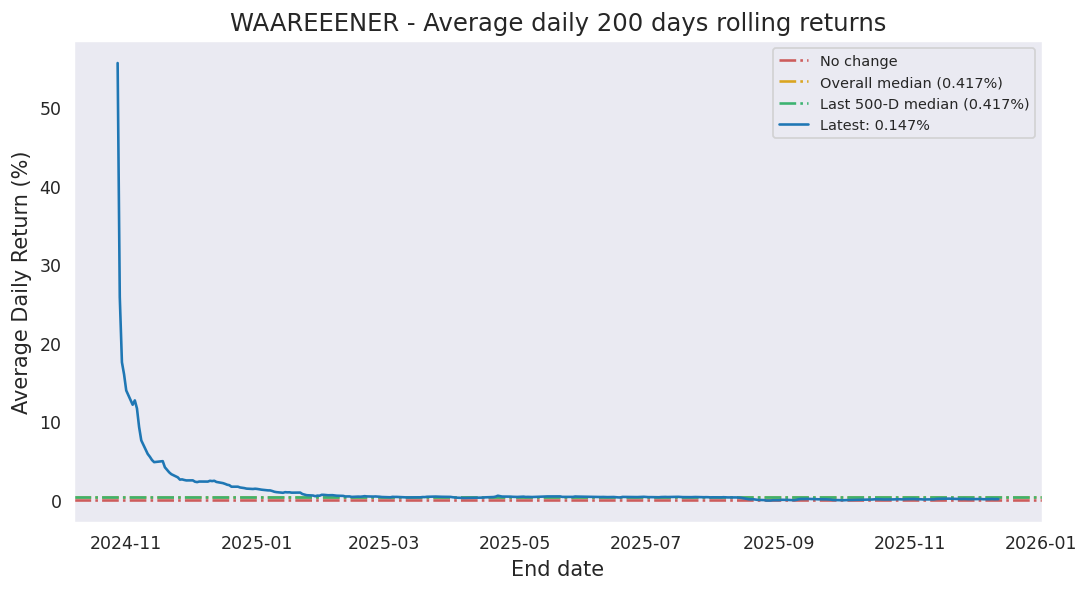
Average of last 200 days: 3118.51
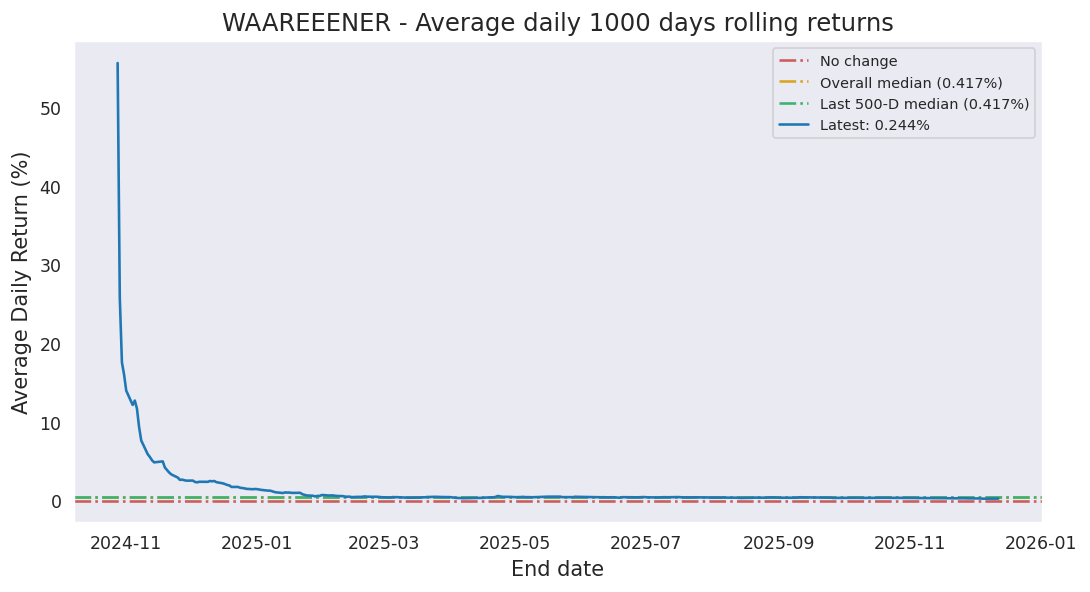
Analysis based on 407 records from October 28, 2024 to June 19, 2026
Last updated on June 19, 2026
| 5 Days | 15 Days | 50 Days | 200 Days | 407 Days | |
|---|---|---|---|---|---|
| Start Date | June 15, 2026 | June 01, 2026 | April 08, 2026 | August 28, 2025 | October 28, 2024 |
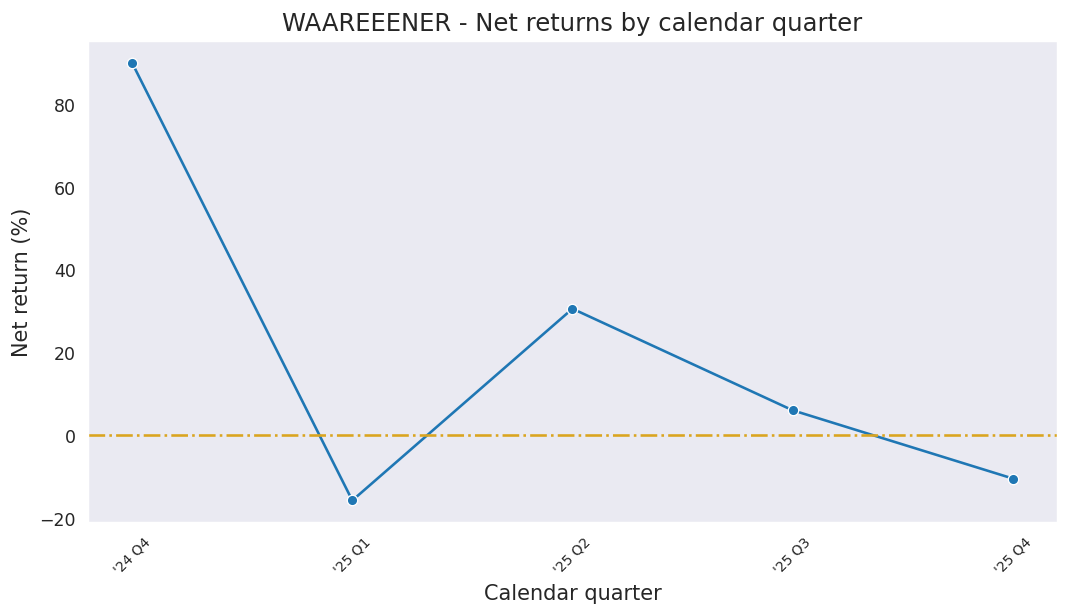
| Net Return | 3.10% | -0.49% | 1.35% | -4.28% | 107.94% |
| Average Daily Return | 0.613% | -0.033% | 0.027% | -0.022% | 0.180% |
| Median Close Price | 3065.90 | 3064.60 | 3121.90 | 3117.60 | 2980.30 |
| Lowest Close Price | 3050.90 | 3003.80 | 2984.20 | 2419.00 | 2091.95 |
| Highest Close Price | 3125.40 | 3125.40 | 3502.90 | 3739.80 | 3739.80 |
| Mean Value Traded | 2.91B | 2.40B | 4.75B | 5.42B | 6.51B |
Last close price: 3125.4
Average of last 15 days: 3059.83
Average of last 50 days: 3173.04
Average of last 200 days: 3118.51
WAAREEENER first closed above its last close price on Tuesday, November 05, 2024 which was 591 days ago.
Since then, it has closed over this price 30.7% of times which is 123 trading days.
Previously, WAAREEENER closed above its last close price on Friday, May 29, 2026 which was 21 days ago.
Historically, this stock gave a non-positive return for a maximum period of 591 days which was from November 05, 2024 to June 19, 2026.
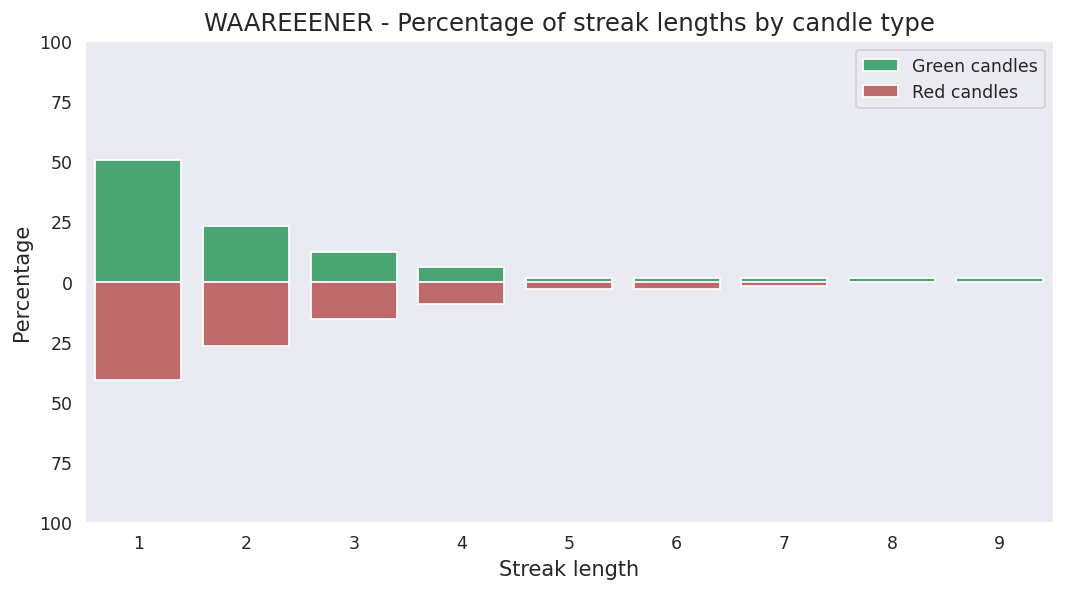
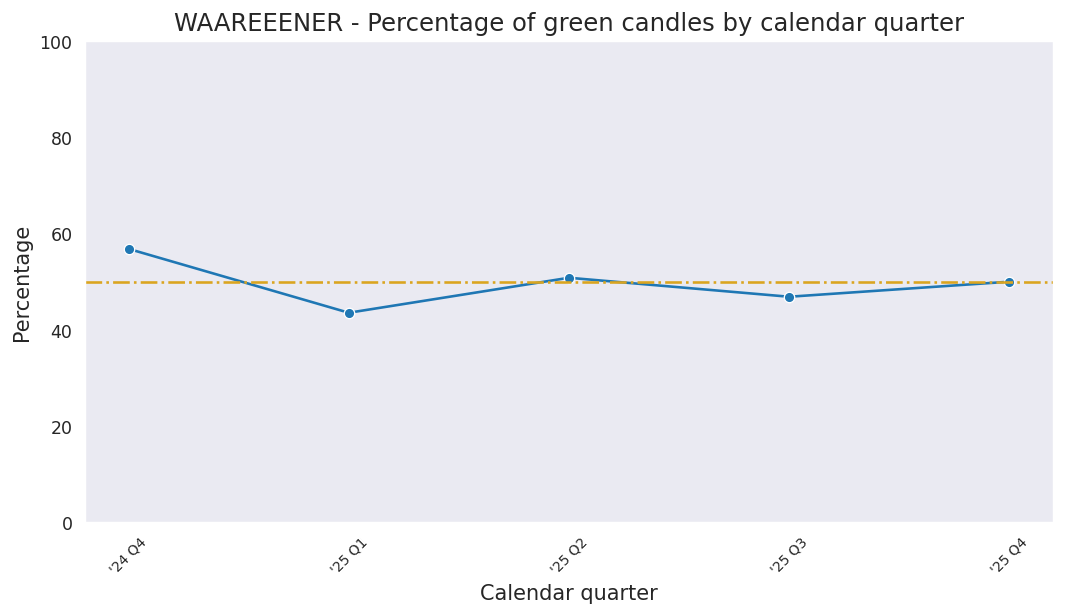
Last candle: Green (1.94%)
Overall percentage of Green candles: 49.6%
Current streak of Green candles: 1
Net change so far for the current streak: 1.94%
Probability of streak continuing: 50.5%
Longest streak of Green candles: 9 trading days from April 08, 2025 to April 23, 2025
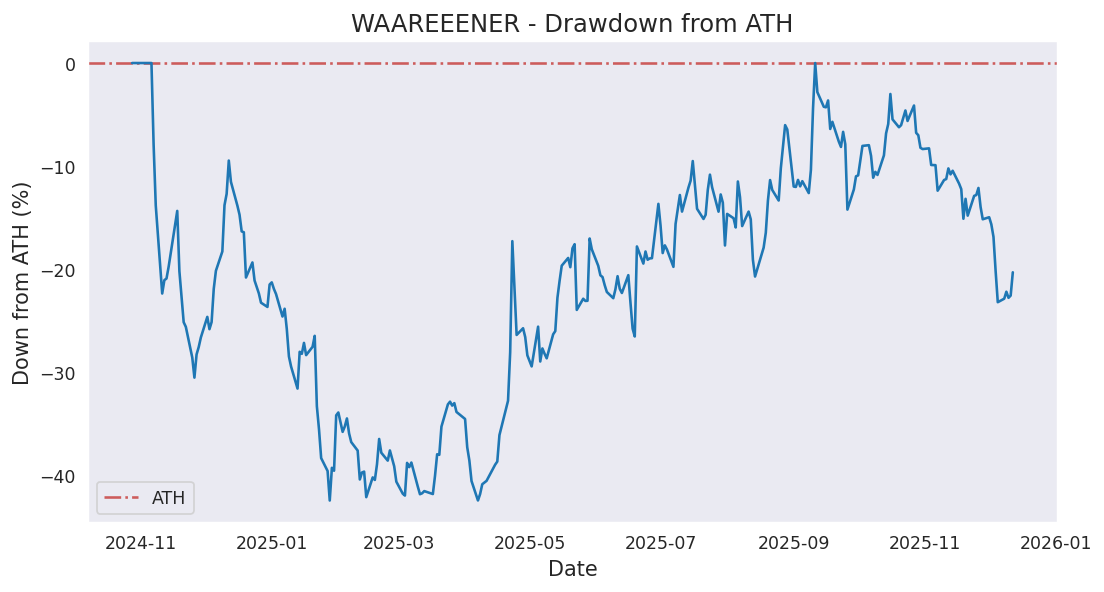
Current down from ATH: -16.43%
Most down from ATH: -42.48%
ATH hits in last 1000 days: 9
ATH was last hit on Thursday, September 11, 2025.