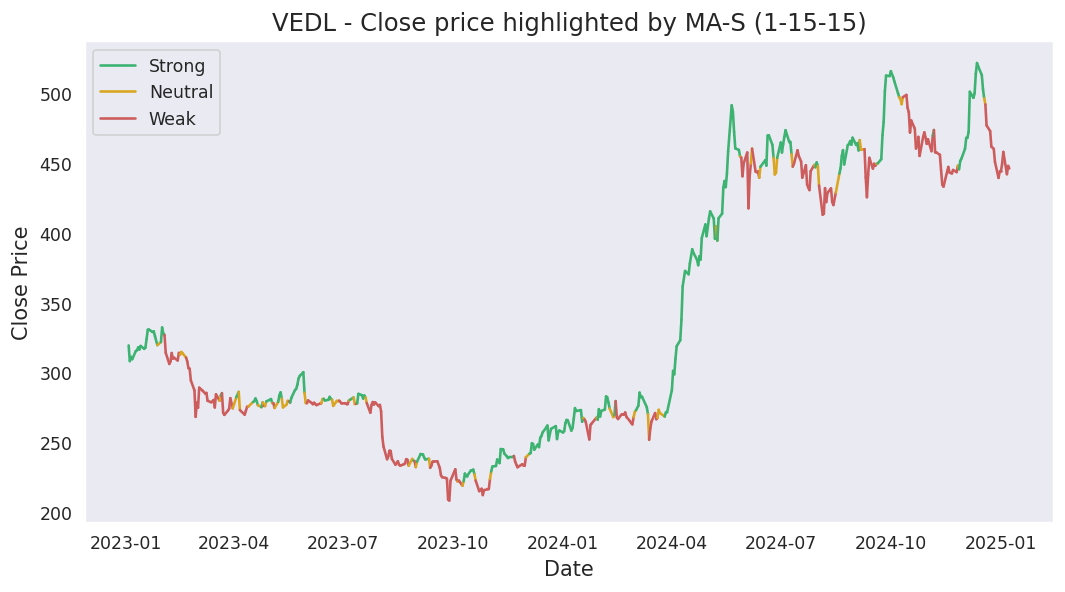
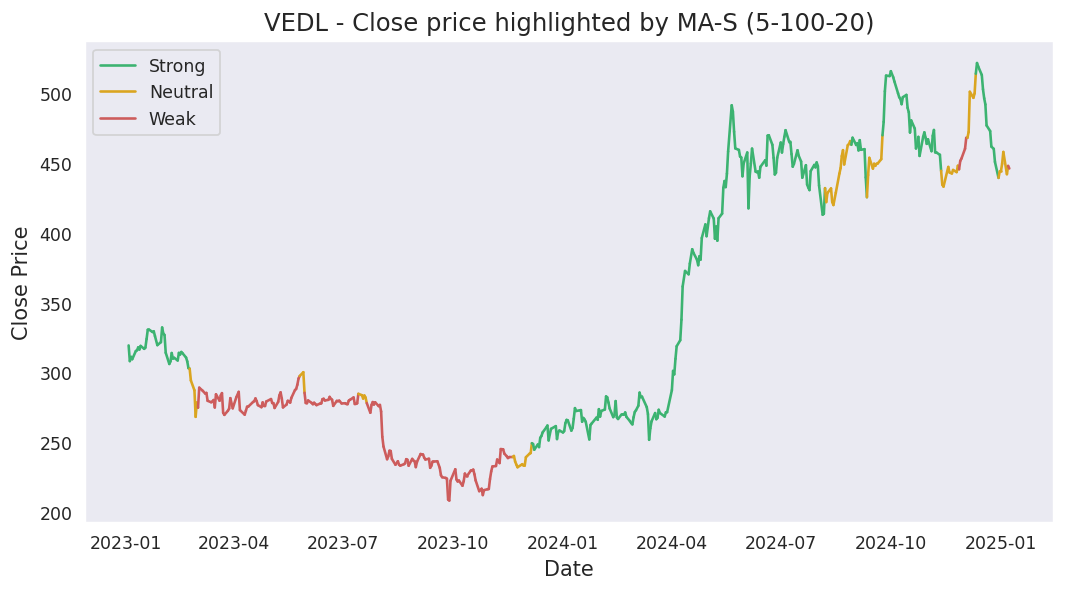
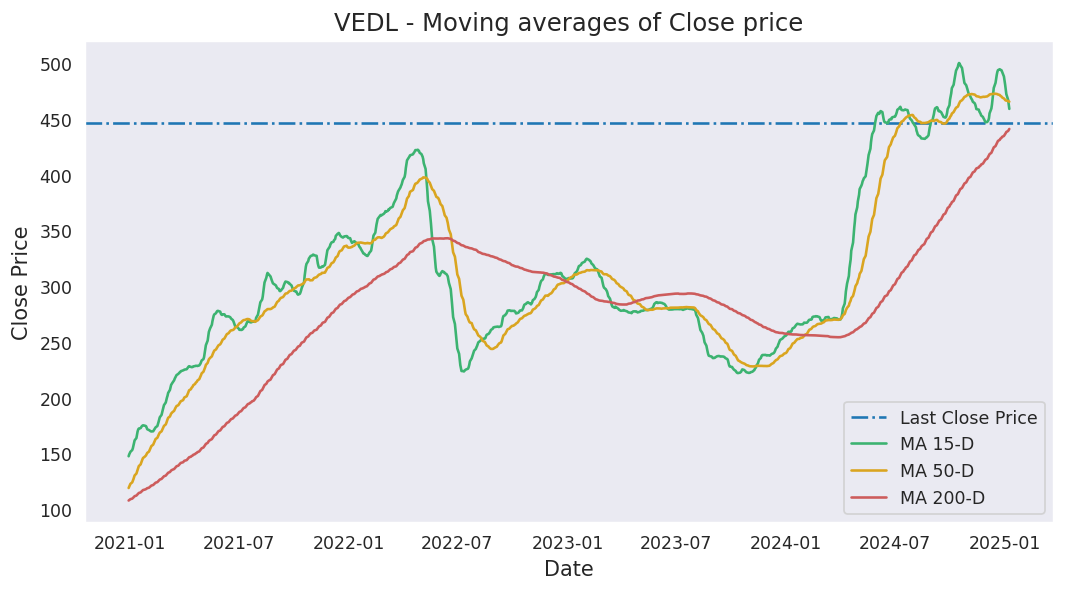
Moving averages
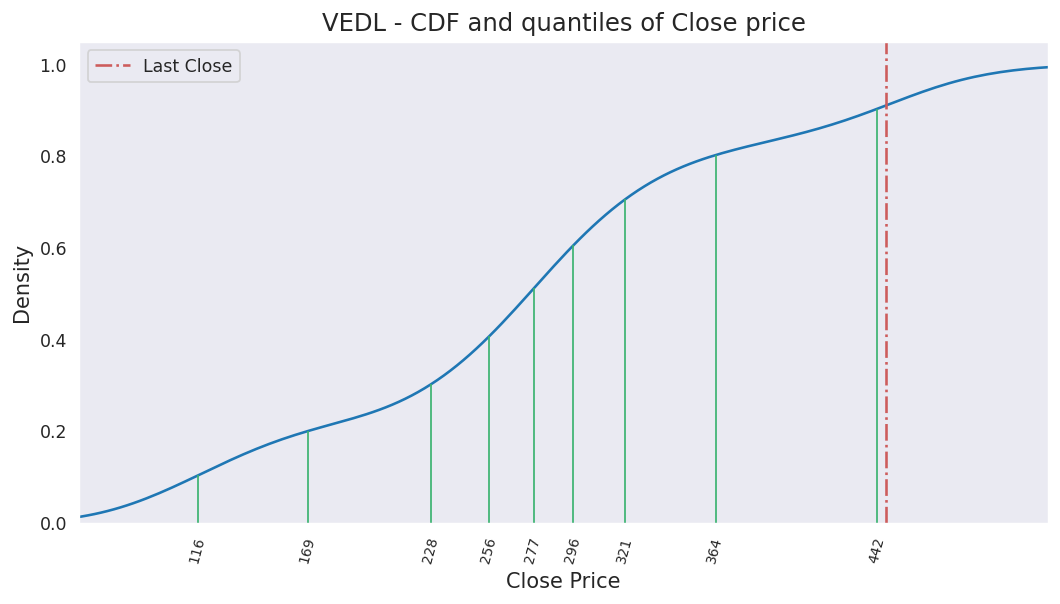
Last close price: 300.8
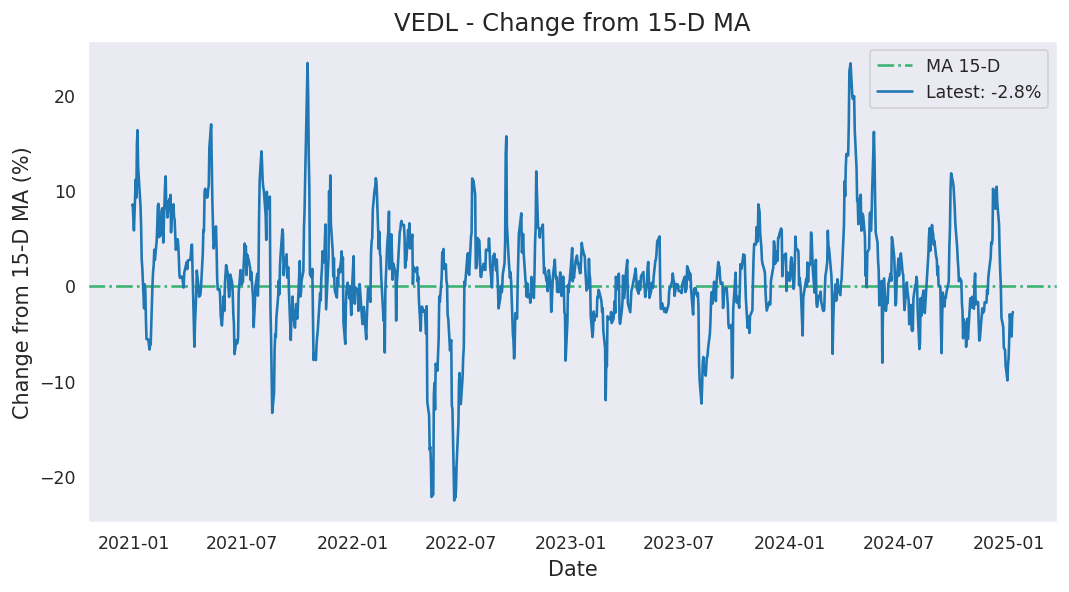
Average of last 15 days: 312.14
Average of last 50 days: 448.19
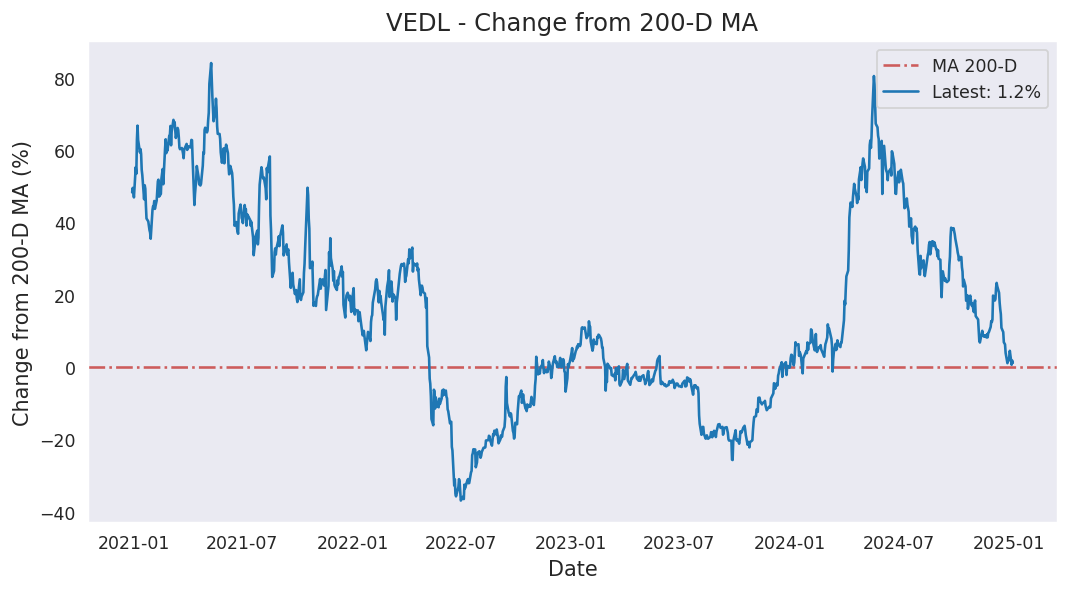
Average of last 200 days: 543.97
Analysis based on 1606 records from January 01, 2020 to June 19, 2026
Last updated on June 19, 2026
| 5 Days | 15 Days | 50 Days | 200 Days | 1000 Days | |
|---|---|---|---|---|---|
| Start Date | June 15, 2026 | June 01, 2026 | April 08, 2026 | August 28, 2025 | June 08, 2022 |
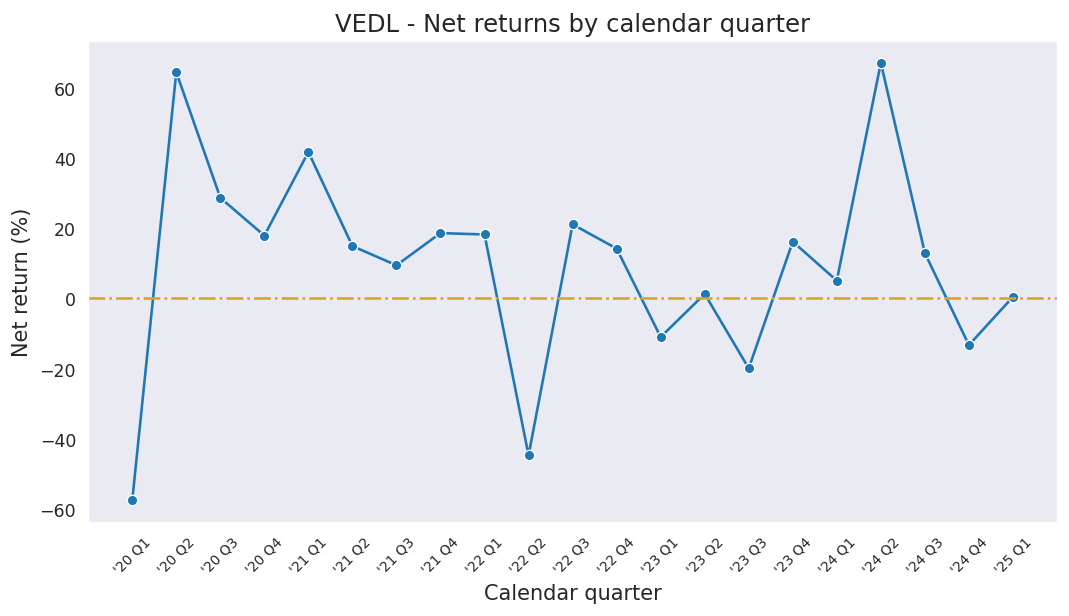
| Net Return | -2.86% | -14.69% | -57.83% | -29.75% | -4.48% |
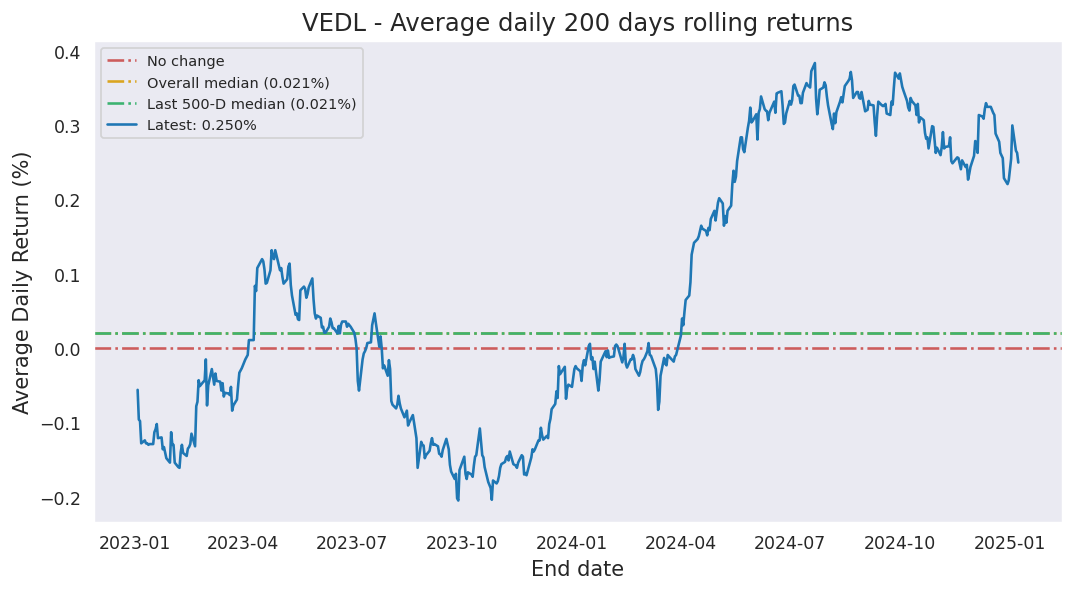
| Average Daily Return | -0.578% | -1.054% | -1.712% | -0.176% | -0.005% |
| Median Close Price | 302.50 | 306.25 | 330.50 | 524.92 | 379.17 |
| Lowest Close Price | 299.95 | 299.30 | 271.55 | 271.55 | 208.35 |
| Highest Close Price | 306.50 | 337.15 | 787.50 | 787.50 | 787.50 |
| Mean Value Traded | 5.77B | 5.93B | 12.19B | 9.18B | 5.13B |
Last close price: 300.8
Average of last 15 days: 312.14
Average of last 50 days: 448.19
Average of last 200 days: 543.97
VEDL first closed above its last close price on Friday, July 30, 2021 which was 1785 days ago.
Since then, it has closed over this price 66.7% of times which is 809 trading days.
Previously, VEDL closed above its last close price on Thursday, June 18, 2026 which was 1 days ago.
Historically, this stock gave a non-positive return for a maximum period of 1819 days which was from May 07, 2021 to April 30, 2026.
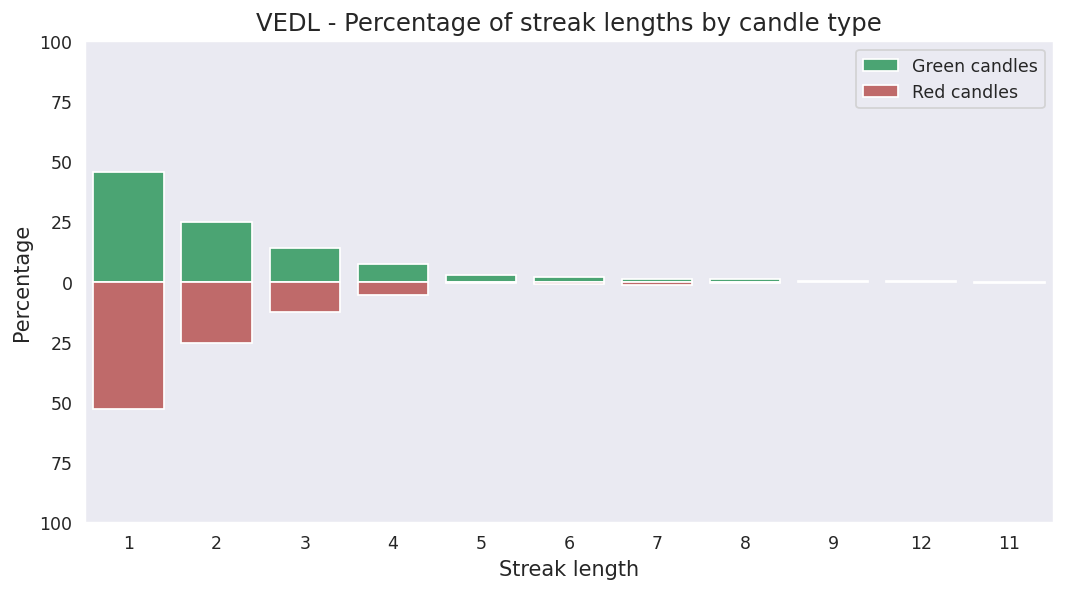
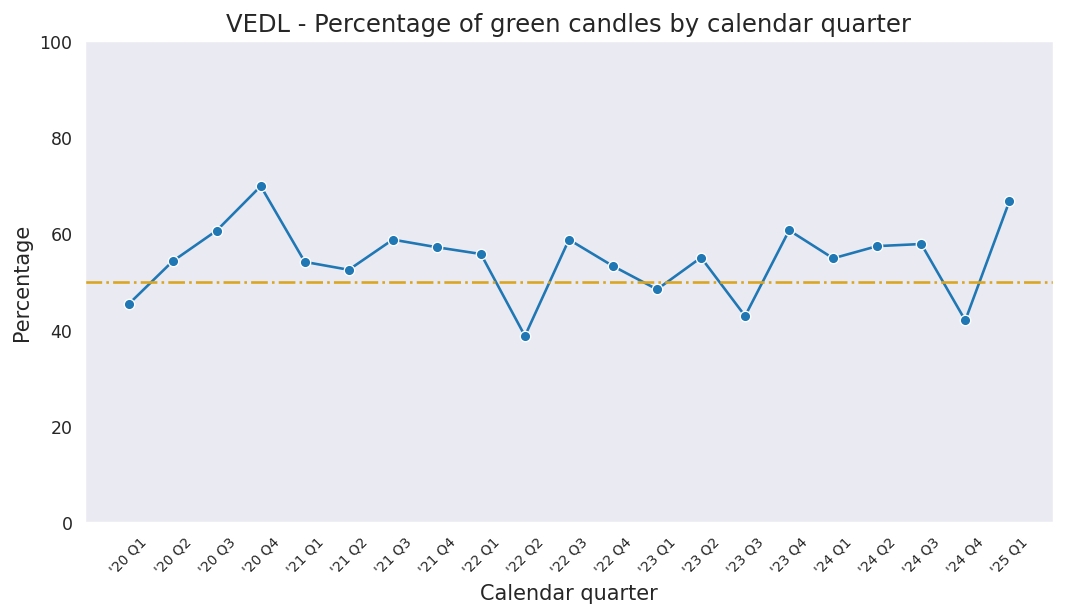
Last candle: Red (-1.70%)
Overall percentage of Red candles: 45.3%
Current streak of Red candles: 2
Net change so far for the current streak: -1.86%
Probability of streak continuing: 45.4%
Longest streak of Red candles: 11 trading days from December 13, 2024 to December 30, 2024
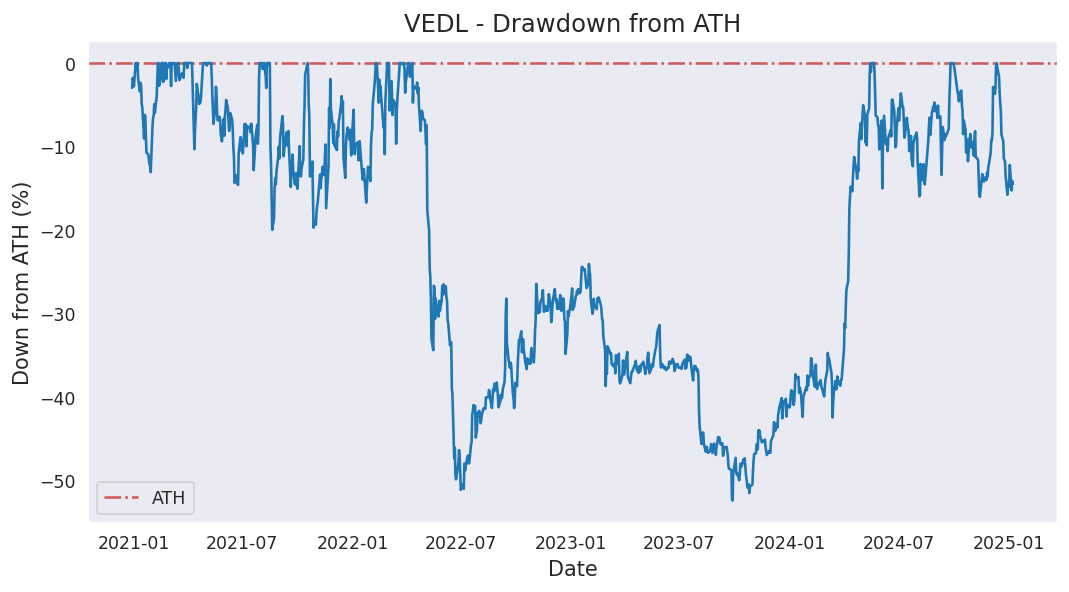
Current down from ATH: -61.80%
Most down from ATH: -65.52%
ATH hits in last 1000 days: 35
ATH was last hit on Friday, April 17, 2026.