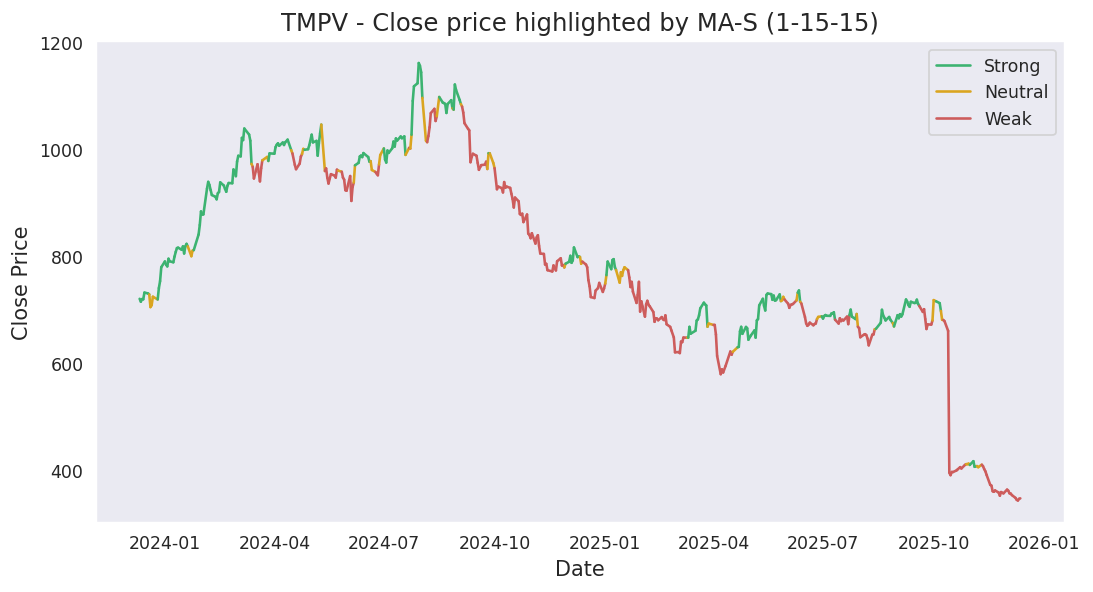
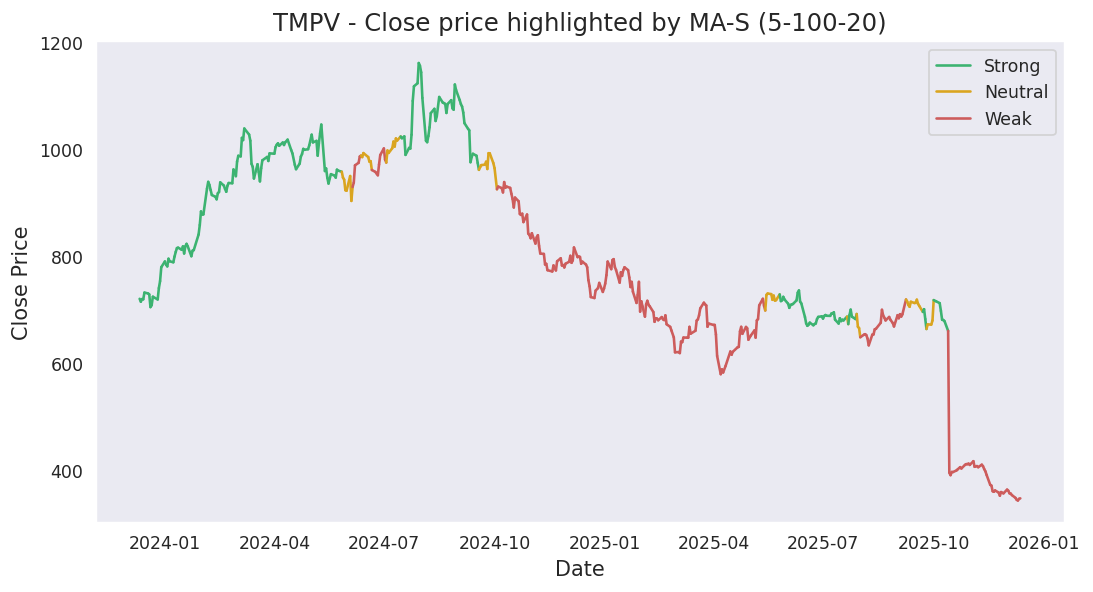
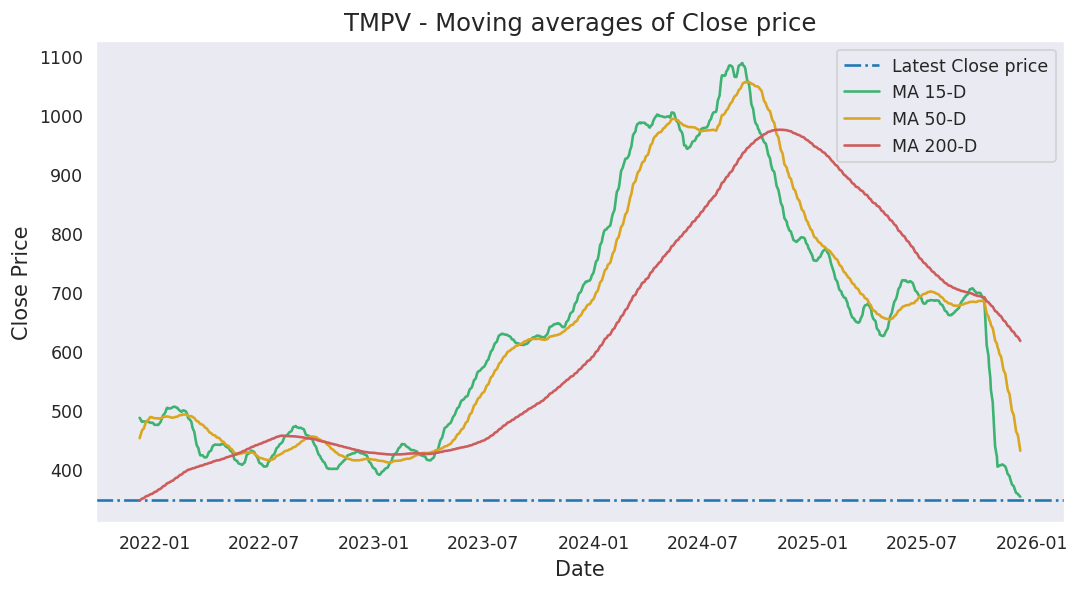
Moving averages
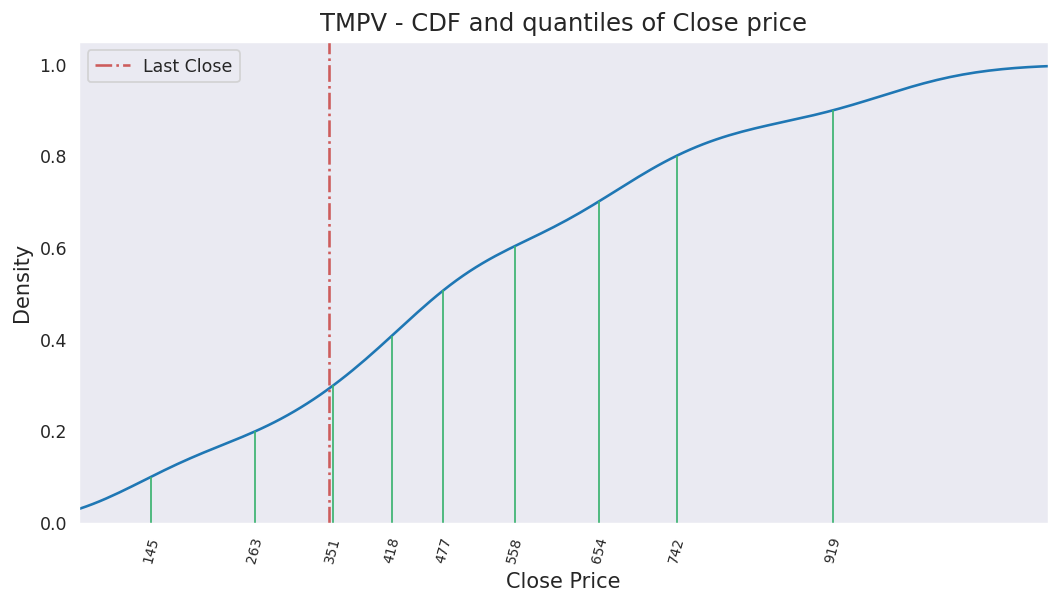
Last close price: 359.5
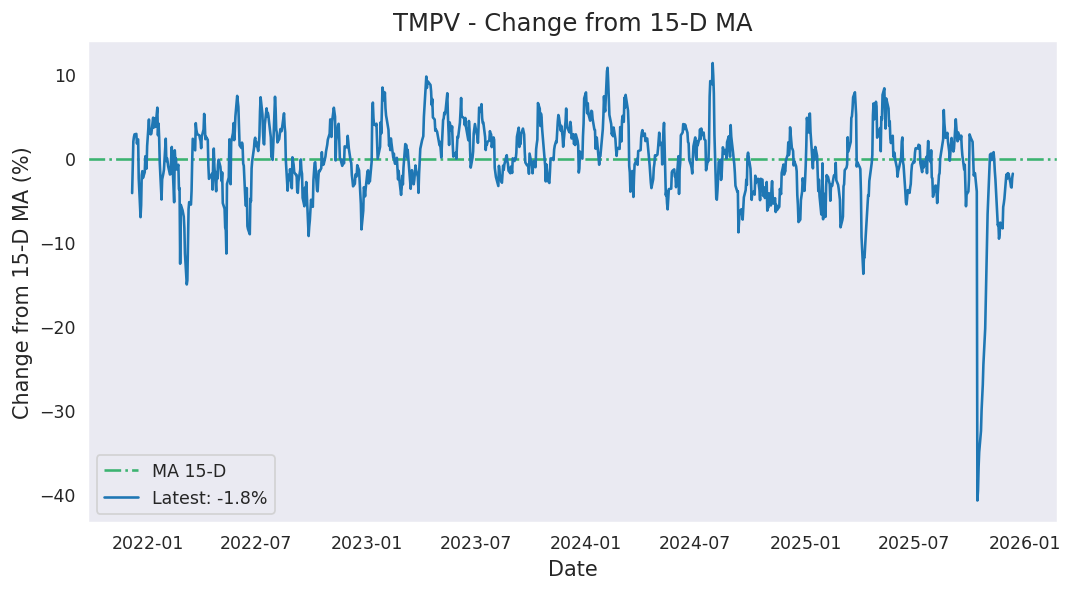
Average of last 15 days: 384.64
Average of last 50 days: 364.01
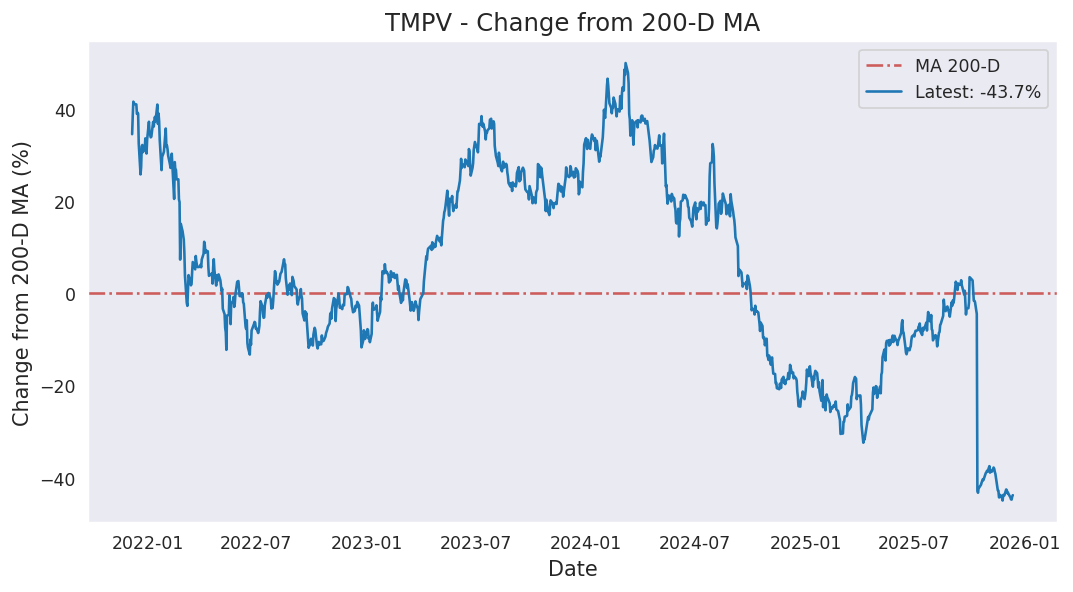
Average of last 200 days: 415.59
Analysis based on 1606 records from January 01, 2020 to June 19, 2026
Last updated on June 19, 2026
| 5 Days | 15 Days | 50 Days | 200 Days | 1000 Days | |
|---|---|---|---|---|---|
| Start Date | June 15, 2026 | June 01, 2026 | April 08, 2026 | August 28, 2025 | June 08, 2022 |
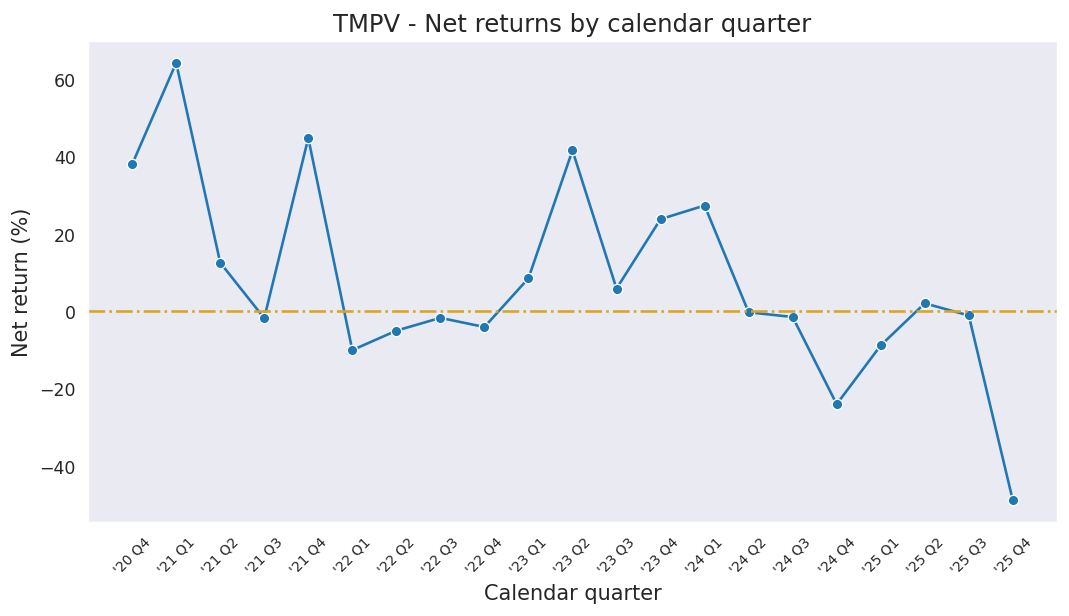
| Net Return | -7.82% | -8.73% | 16.46% | -47.26% | -17.52% |
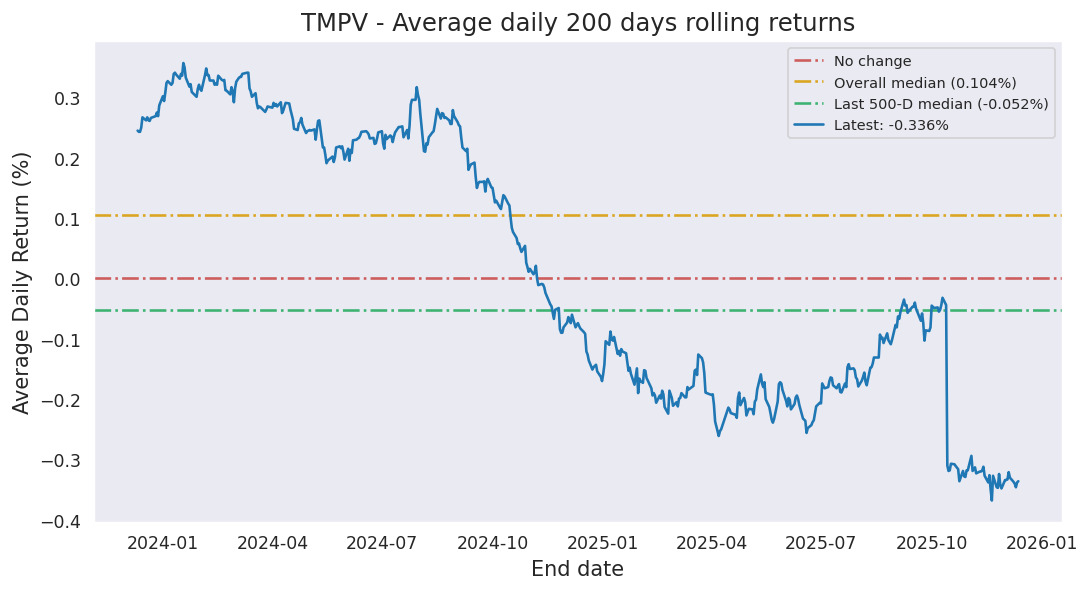
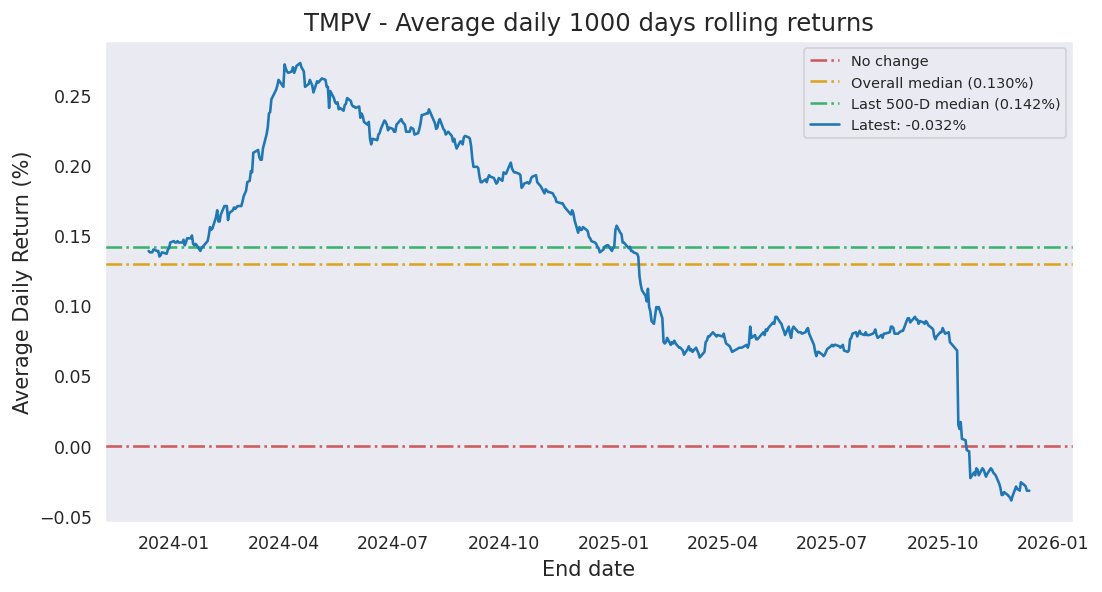
| Average Daily Return | -1.615% | -0.607% | 0.305% | -0.319% | -0.019% |
| Median Close Price | 364.65 | 389.00 | 359.38 | 363.35 | 628.10 |
| Lowest Close Price | 359.50 | 359.50 | 333.25 | 296.20 | 296.20 |
| Highest Close Price | 396.40 | 399.70 | 400.95 | 719.50 | 1161.85 |
| Mean Value Traded | 7.71B | 4.89B | 4.43B | 5.17B | 7.96B |
Last close price: 359.5
Average of last 15 days: 384.64
Average of last 50 days: 364.01
Average of last 200 days: 415.59
TMPV first closed above its last close price on Thursday, October 07, 2021 which was 1716 days ago.
Since then, it has closed over this price 92.7% of times which is 1080 trading days.
Previously, TMPV closed above its last close price on Thursday, June 18, 2026 which was 1 days ago.
Historically, this stock gave a non-positive return for a maximum period of 1899 days which was from March 02, 2021 to May 14, 2026.
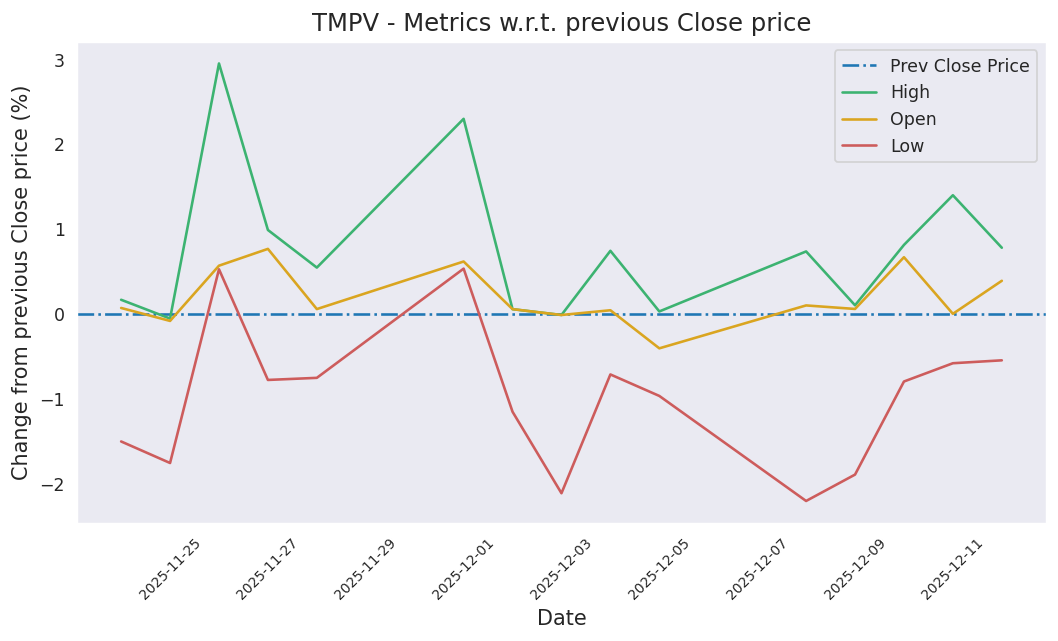
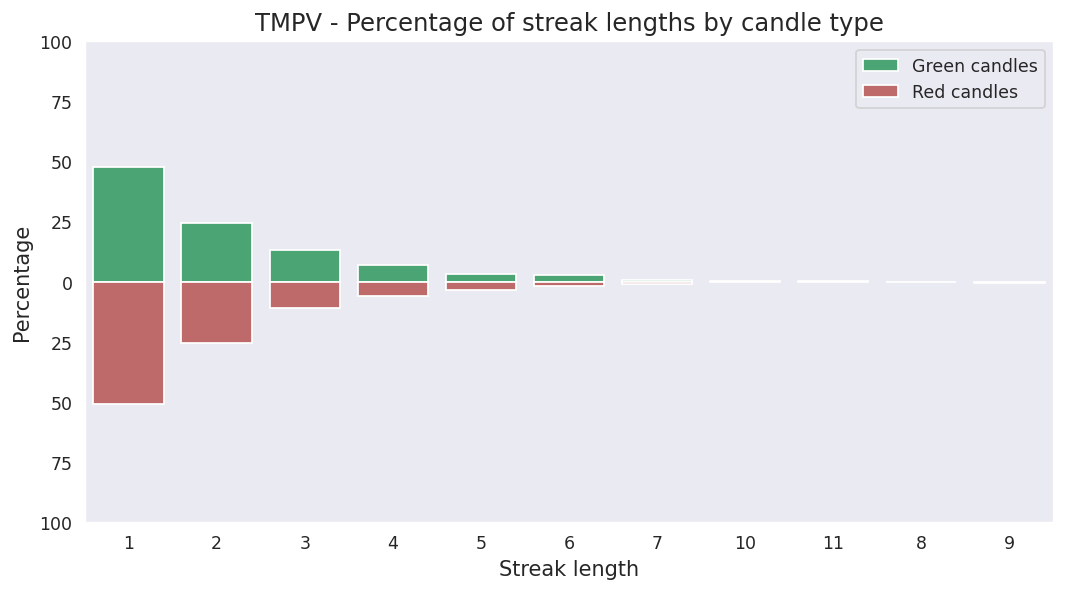
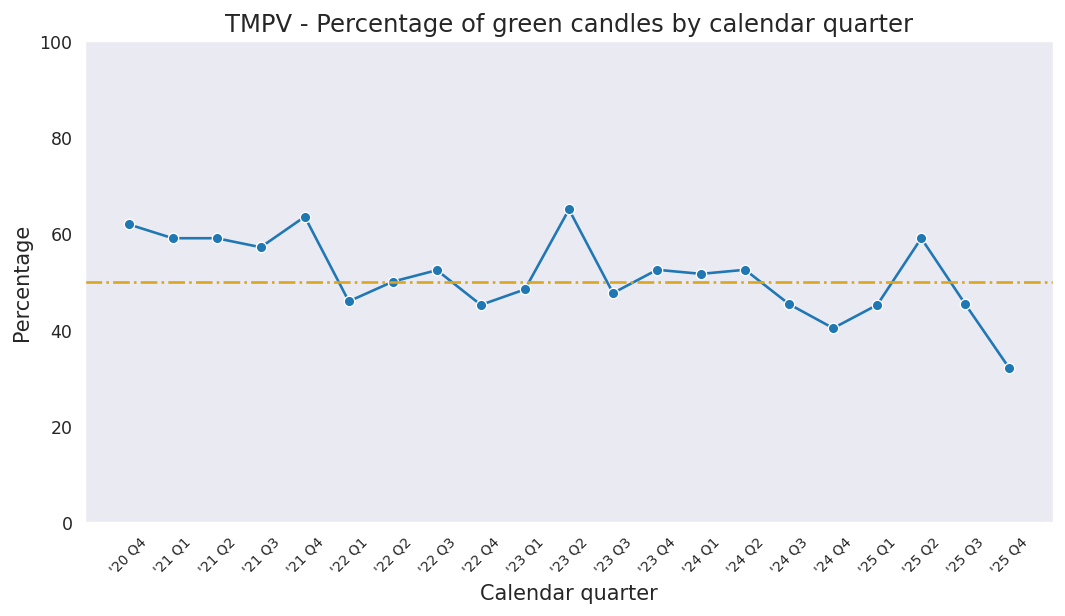
Last candle: Red (-1.41%)
Overall percentage of Red candles: 48.8%
Current streak of Red candles: 1
Net change so far for the current streak: -1.41%
Probability of streak continuing: 49.7%
Longest streak of Red candles: 9 trading days from October 03, 2025 to October 15, 2025
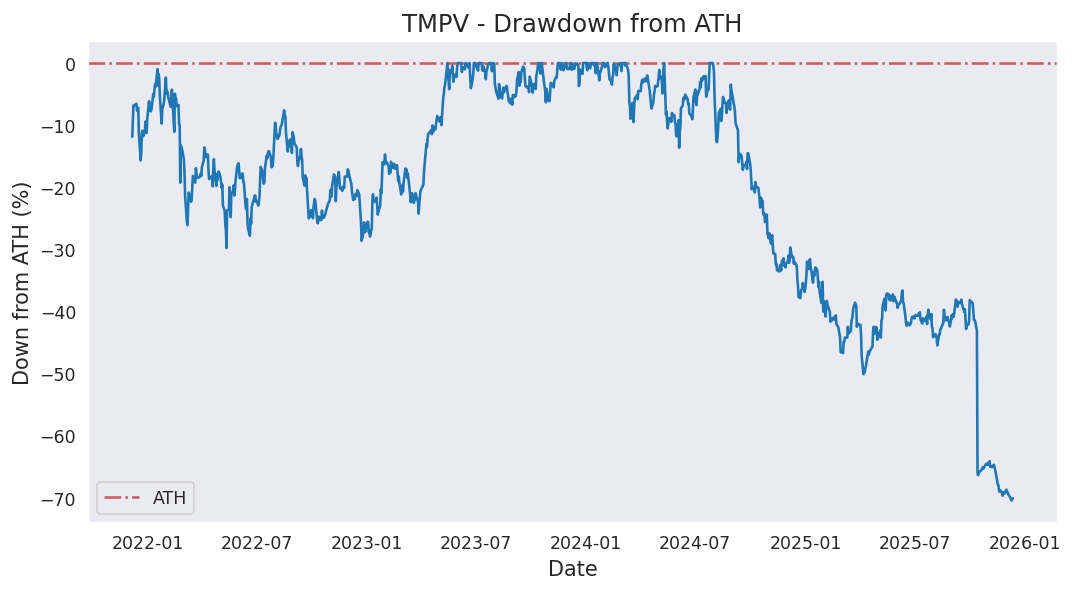
Current down from ATH: -69.06%
Most down from ATH: -74.51%
ATH hits in last 1000 days: 57
ATH was last hit on Tuesday, July 30, 2024.