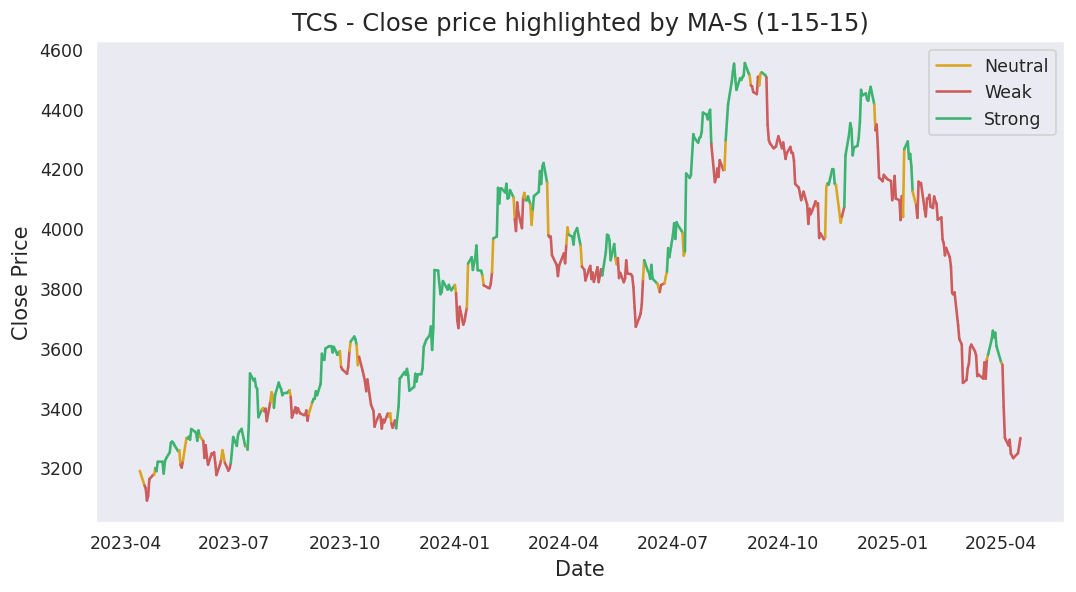
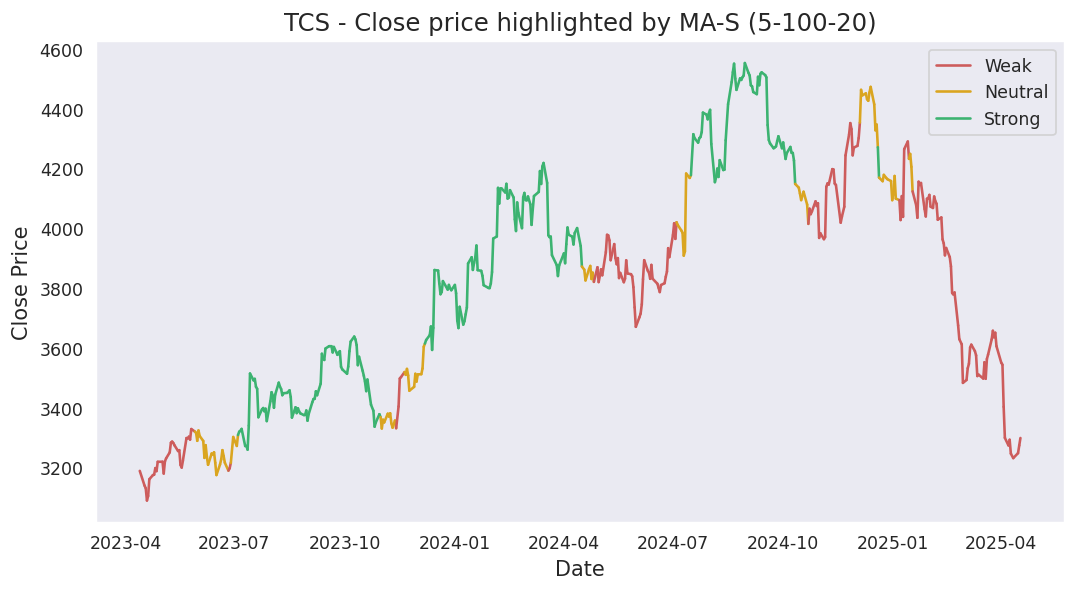
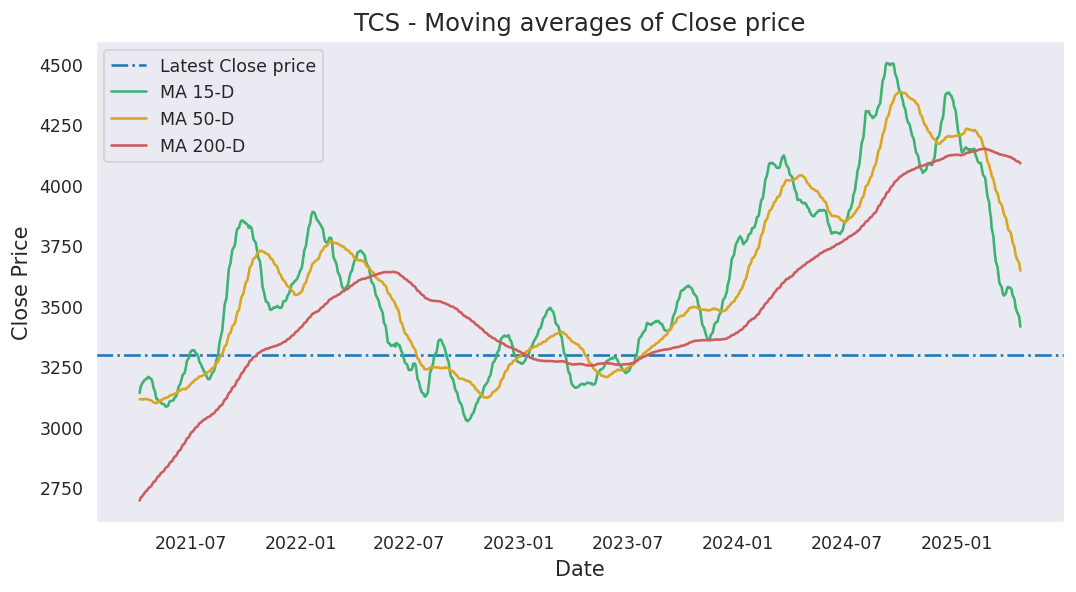
Moving averages
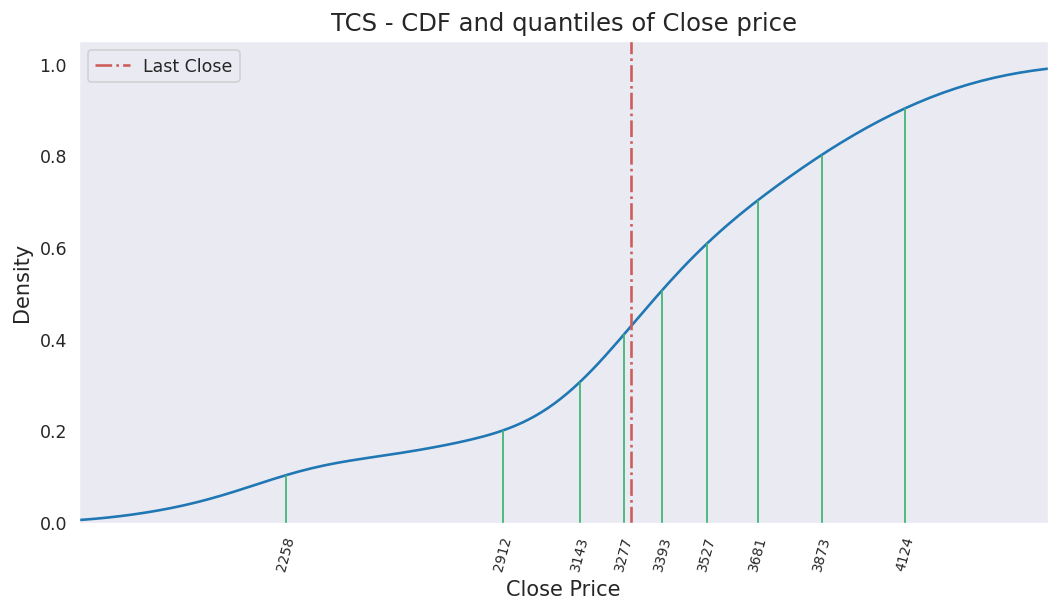
Last close price: 2125.0
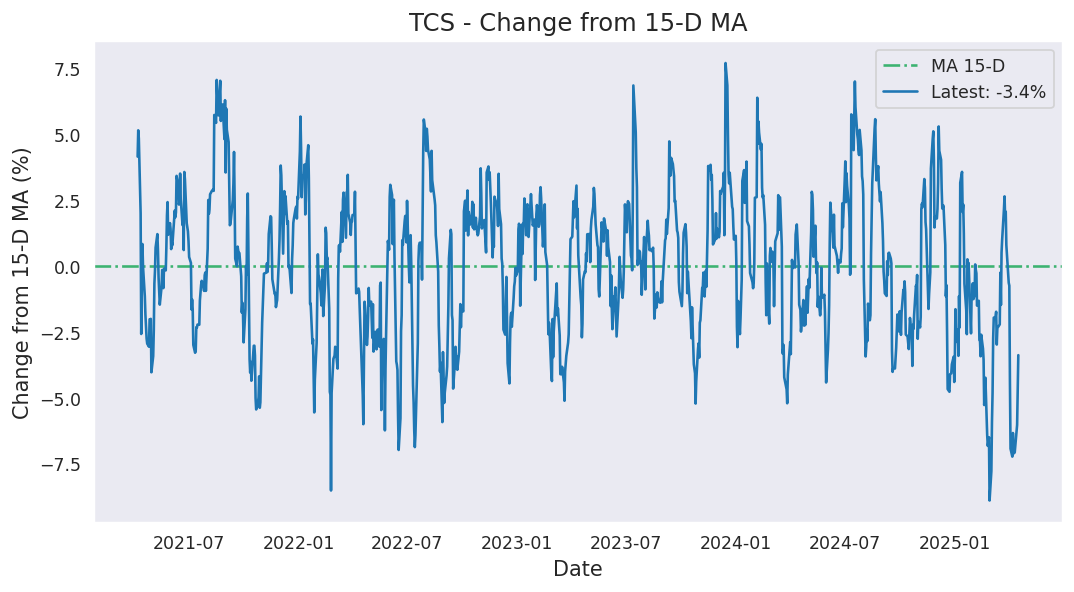
Average of last 15 days: 2206.10
Average of last 50 days: 2354.27
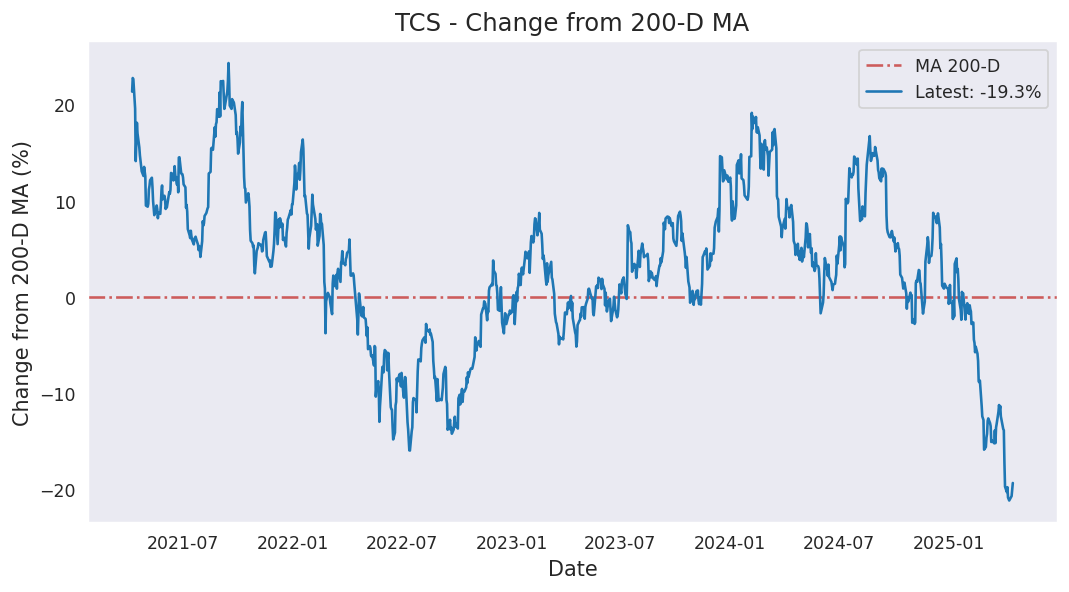
Average of last 200 days: 2821.38
Analysis based on 1606 records from January 01, 2020 to June 19, 2026
Last updated on June 19, 2026
| 5 Days | 15 Days | 50 Days | 200 Days | 1000 Days | |
|---|---|---|---|---|---|
| Start Date | June 15, 2026 | June 01, 2026 | April 08, 2026 | August 28, 2025 | June 08, 2022 |
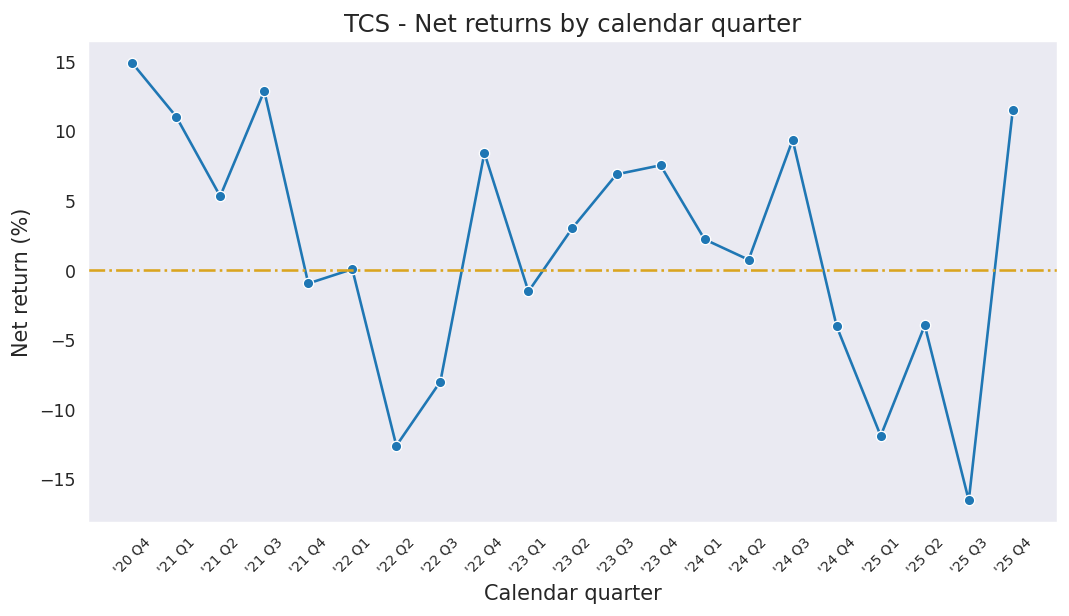
| Net Return | -1.68% | -5.93% | -16.33% | -32.69% | -36.81% |
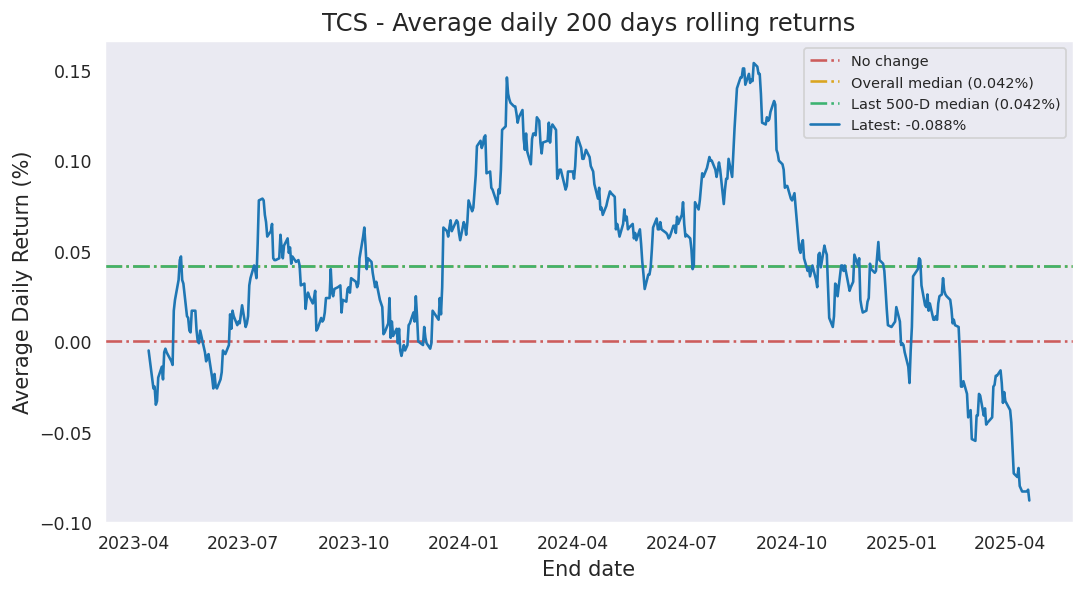
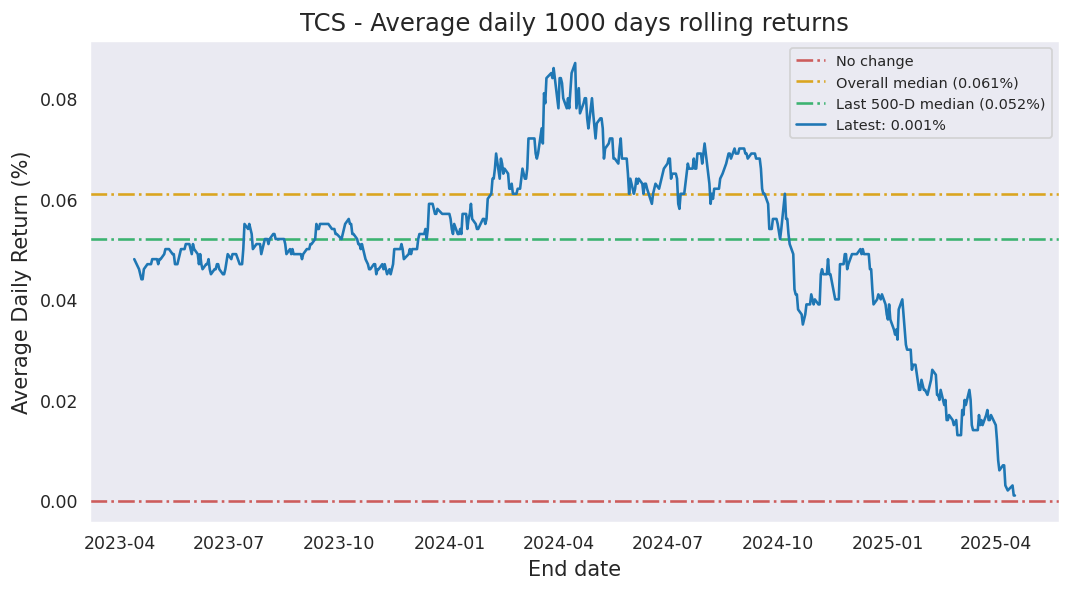
| Average Daily Return | -0.339% | -0.407% | -0.356% | -0.198% | -0.046% |
| Median Close Price | 2199.00 | 2198.90 | 2327.15 | 2986.50 | 3382.98 |
| Lowest Close Price | 2125.00 | 2125.00 | 2125.00 | 2125.00 | 2125.00 |
| Highest Close Price | 2223.00 | 2446.90 | 2610.50 | 3324.90 | 4553.75 |
| Mean Value Traded | 11.26B | 13.25B | 11.66B | 10.05B | 8.49B |
Last close price: 2125.0
Average of last 15 days: 2206.10
Average of last 50 days: 2354.27
Average of last 200 days: 2821.38
TCS first closed above its last close price on Wednesday, January 01, 2020 which was 2361 days ago.
Since then, it has closed over this price 94.6% of times which is 1519 trading days.
Previously, TCS closed above its last close price on Thursday, June 18, 2026 which was 1 days ago.
Historically, this stock gave a non-positive return for a maximum period of 2361 days which was from January 01, 2020 to June 19, 2026.
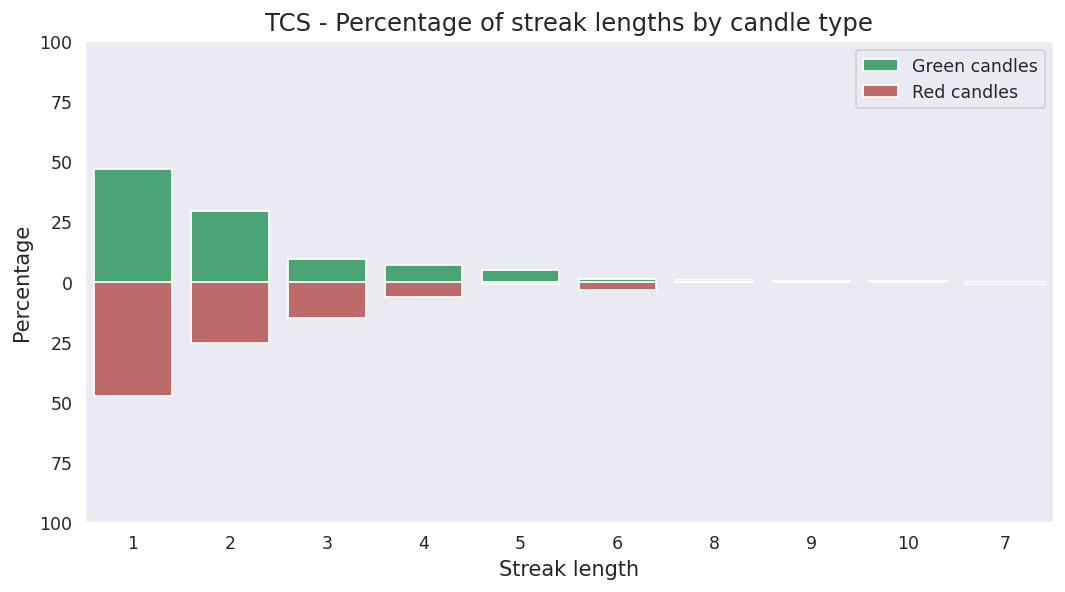
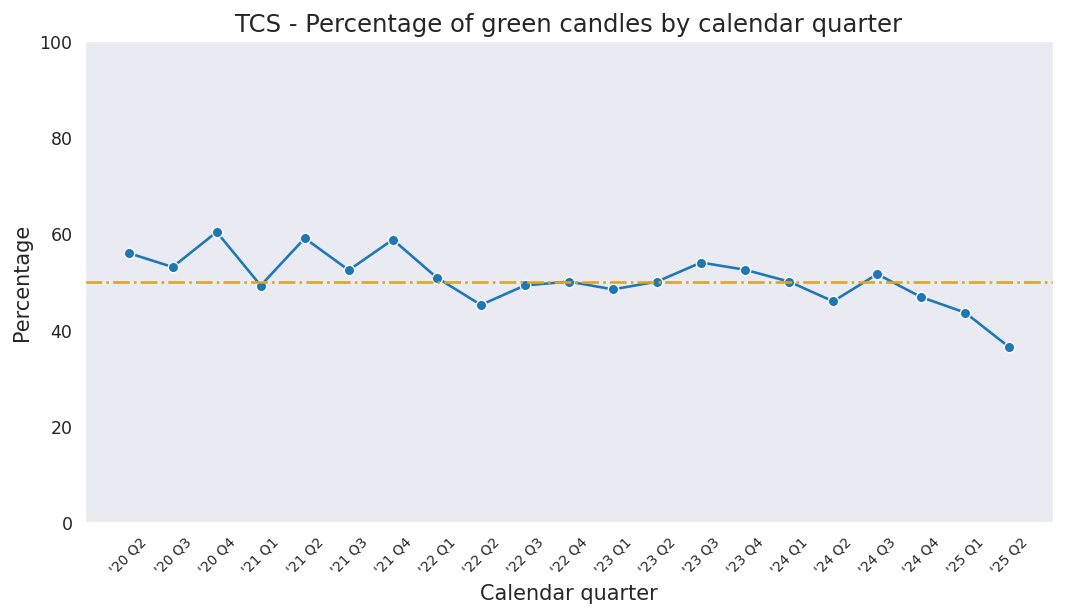
Last candle: Red (-3.55%)
Overall percentage of Red candles: 50.3%
Current streak of Red candles: 2
Net change so far for the current streak: -4.41%
Probability of streak continuing: 51.7%
Longest streak of Red candles: 12 trading days from February 27, 2026 to March 17, 2026
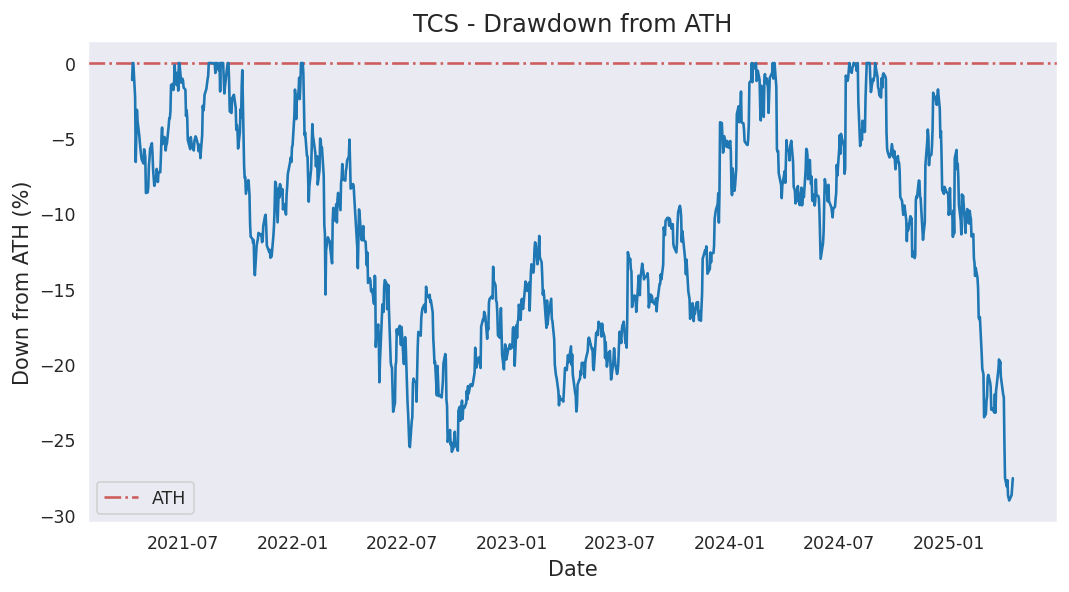
Current down from ATH: -53.34%
Most down from ATH: -53.34%
ATH hits in last 1000 days: 14
ATH was last hit on Friday, August 30, 2024.