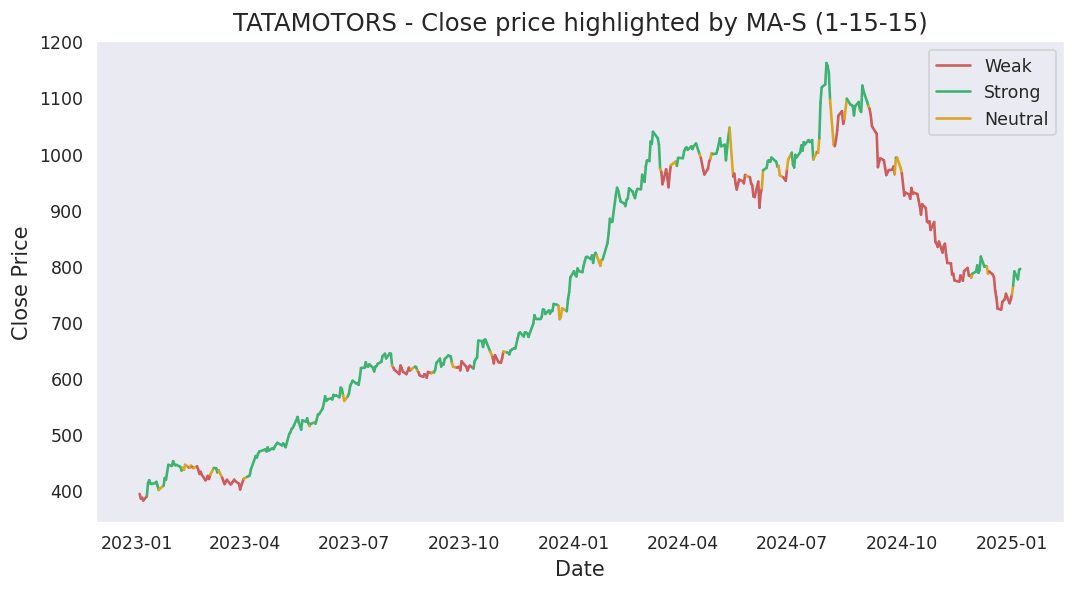
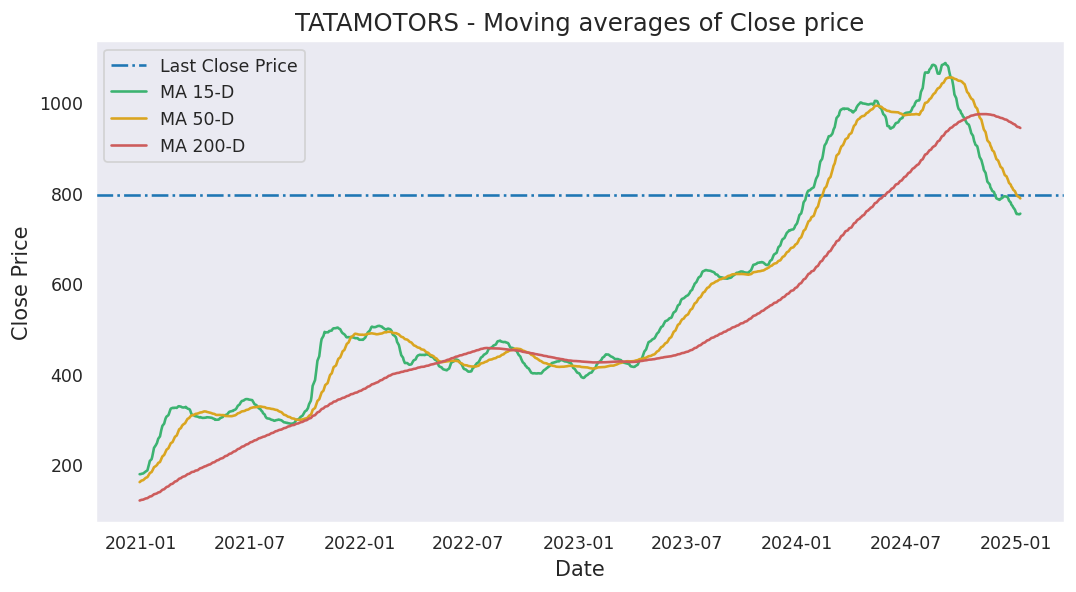
Moving averages
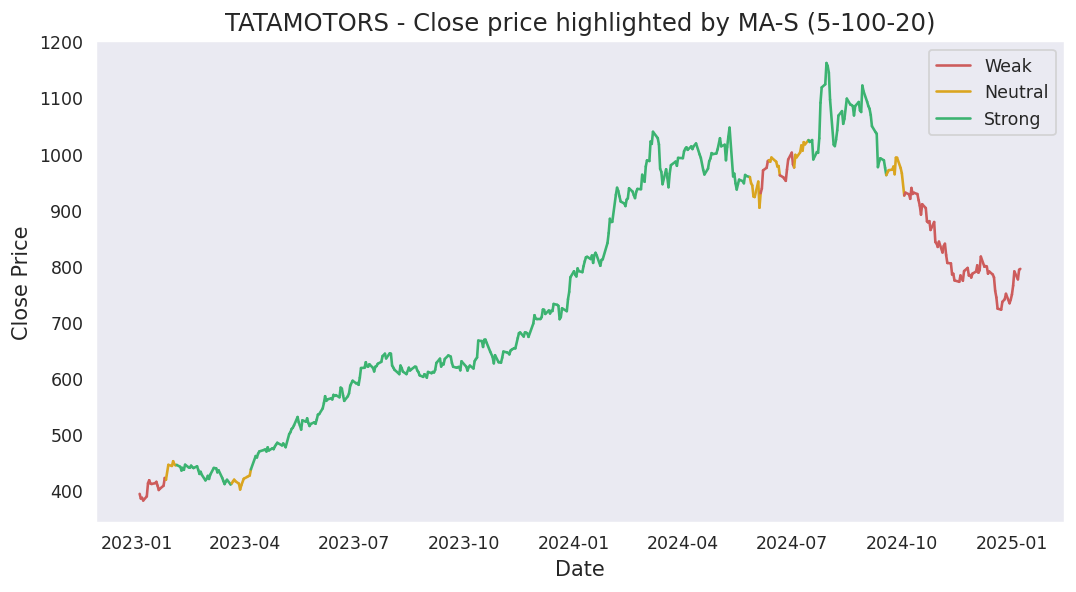
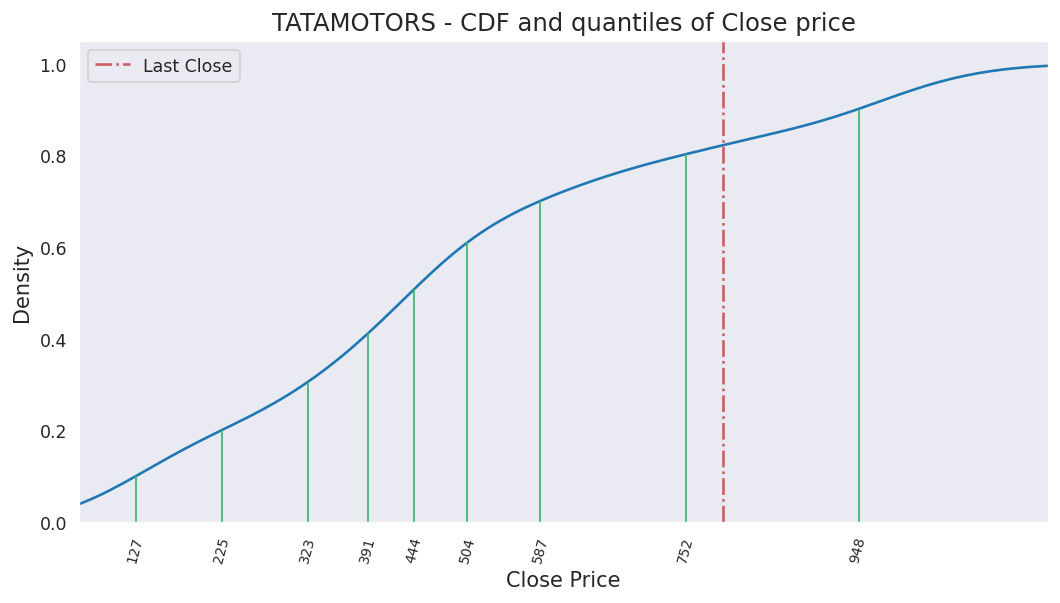
Last close price: 403.3
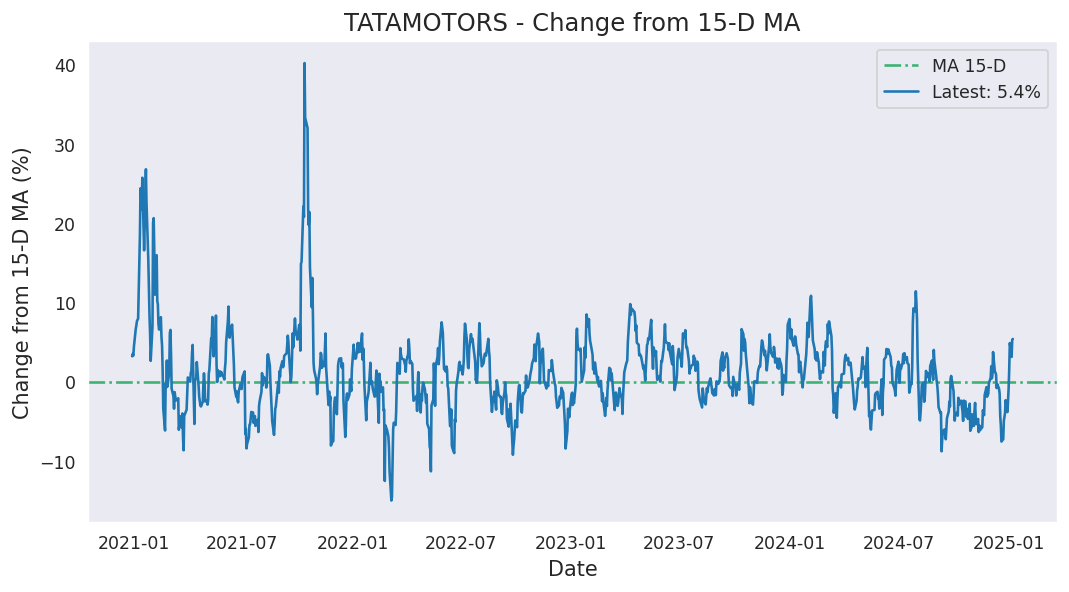
Average of last 15 days: 534.64
Average of last 50 days: 644.21
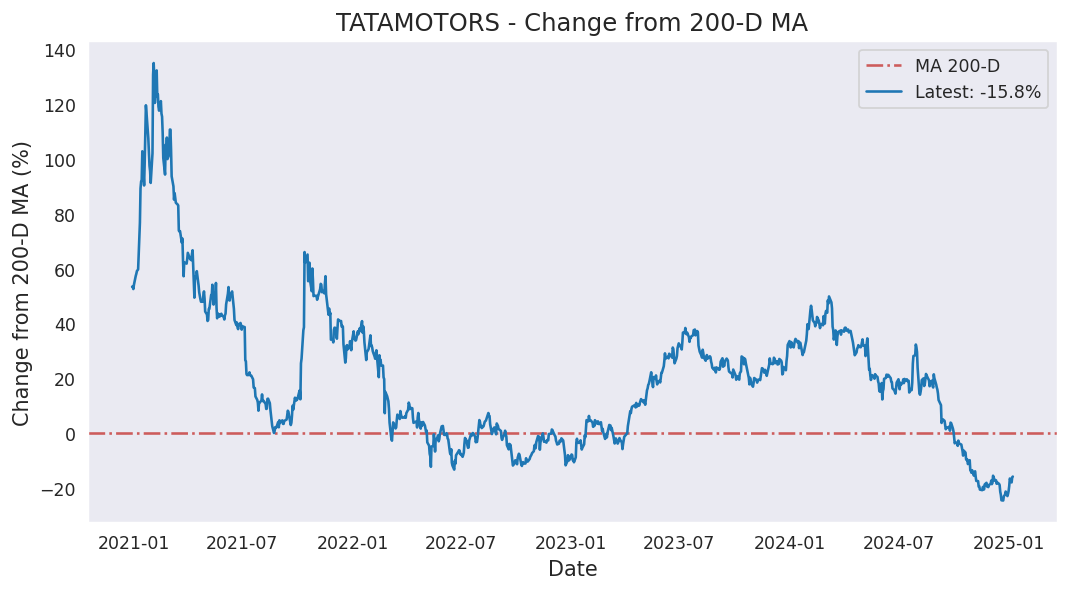
Average of last 200 days: 677.42
Analysis based on 1446 records from January 01, 2020 to October 24, 2025
Last updated on October 24, 2025
| 5 Days | 15 Days | 50 Days | 200 Days | 1000 Days | |
|---|---|---|---|---|---|
| Start Date | October 17, 2025 | October 03, 2025 | August 12, 2025 | January 06, 2025 | October 14, 2021 |
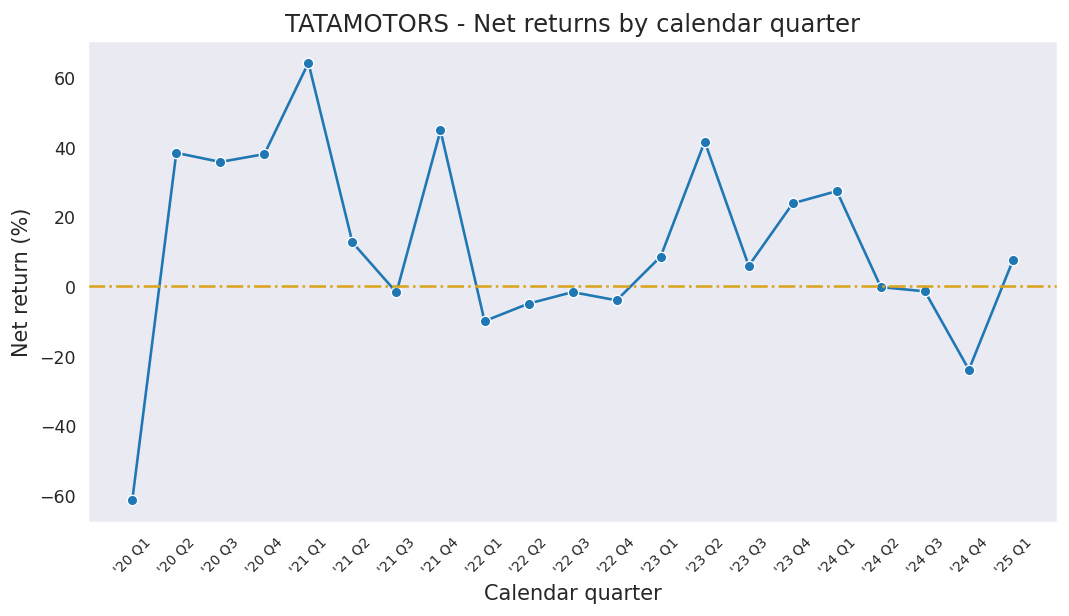
| Net Return | 1.64% | -43.86% | -38.31% | -48.98% | -20.44% |
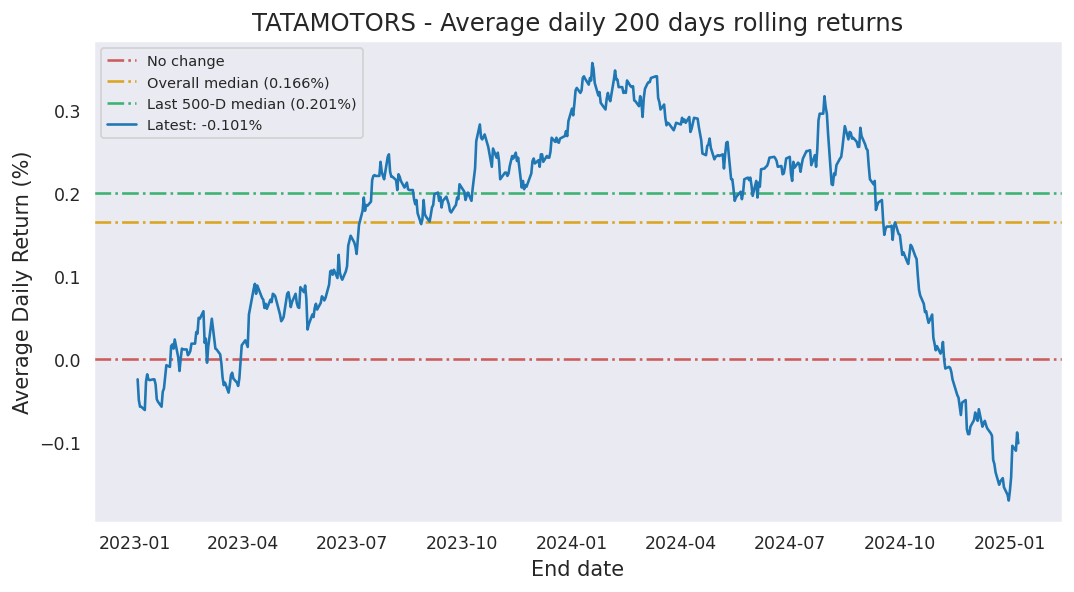
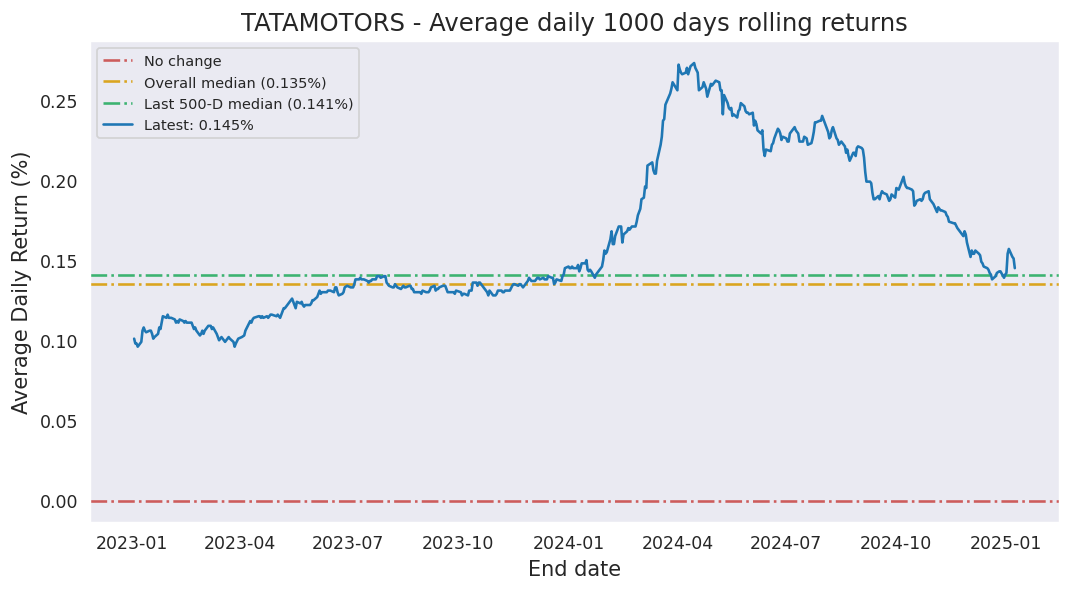
| Average Daily Return | 0.325% | -3.775% | -0.961% | -0.336% | -0.023% |
| Median Close Price | 401.85 | 405.85 | 683.67 | 684.40 | 628.10 |
| Lowest Close Price | 396.60 | 390.85 | 390.85 | 390.85 | 372.30 |
| Highest Close Price | 405.85 | 716.10 | 719.50 | 794.95 | 1161.85 |
| Mean Value Traded | 4.09B | 10.20B | 8.55B | 9.07B | 9.21B |
Last close price: 403.3
Average of last 15 days: 534.64
Average of last 50 days: 644.21
Average of last 200 days: 677.42
TATAMOTORS first closed above its last close price on Monday, October 11, 2021 which was 1474 days ago.
Since then, it has closed over this price 95.1% of times which is 954 trading days.
Previously, TATAMOTORS closed above its last close price on Thursday, October 23, 2025 which was 1 days ago.
Historically, this stock gave a non-positive return for a maximum period of 1474 days which was from October 11, 2021 to October 24, 2025.
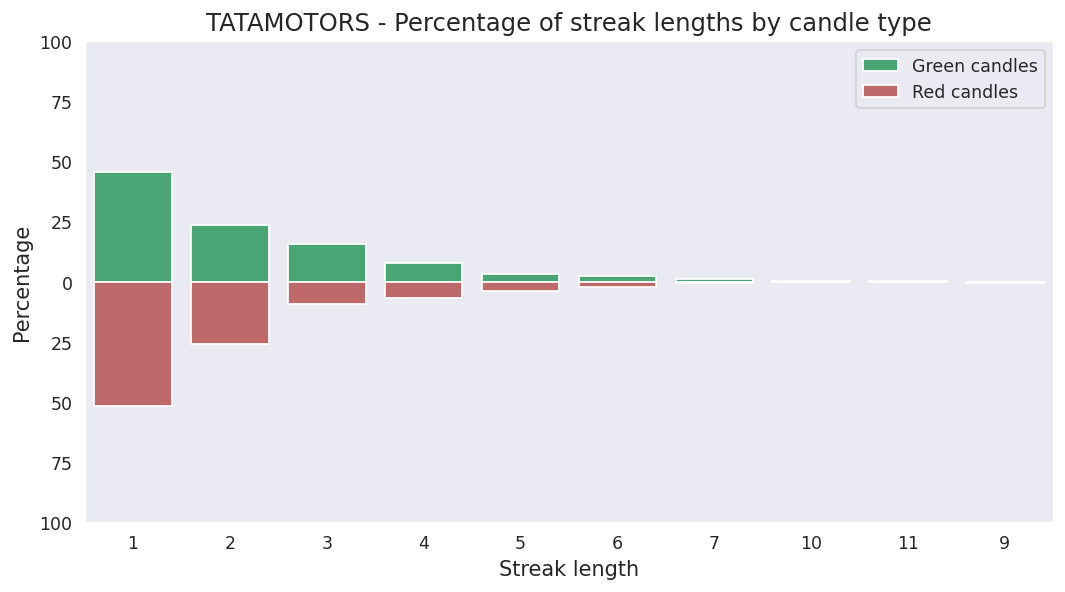
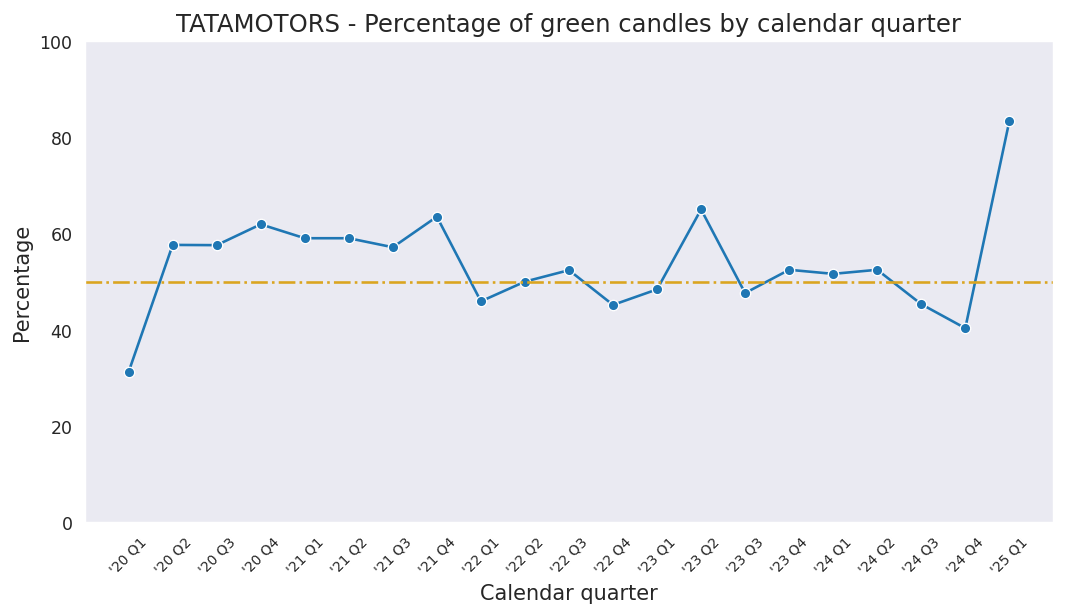
Last candle: Red (-0.63%)
Overall percentage of Red candles: 48.4%
Current streak of Red candles: 1
Net change so far for the current streak: -0.63%
Probability of streak continuing: 49.2%
Longest streak of Red candles: 9 trading days from October 03, 2025 to October 15, 2025
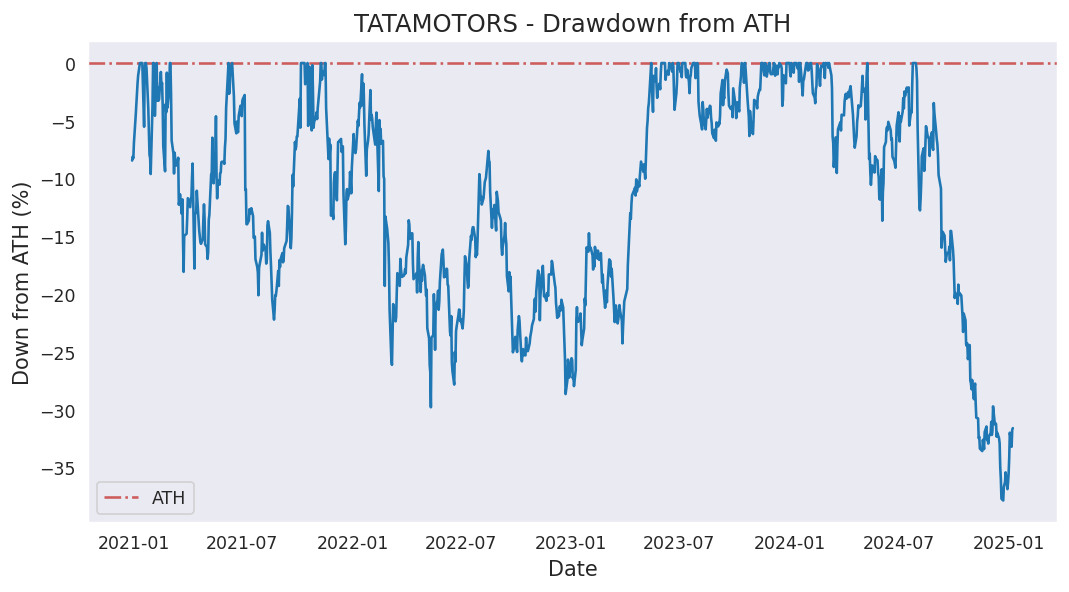
Current down from ATH: -65.29%
Most down from ATH: -67.41%
ATH hits in last 1000 days: 62
ATH was last hit on Tuesday, July 30, 2024.