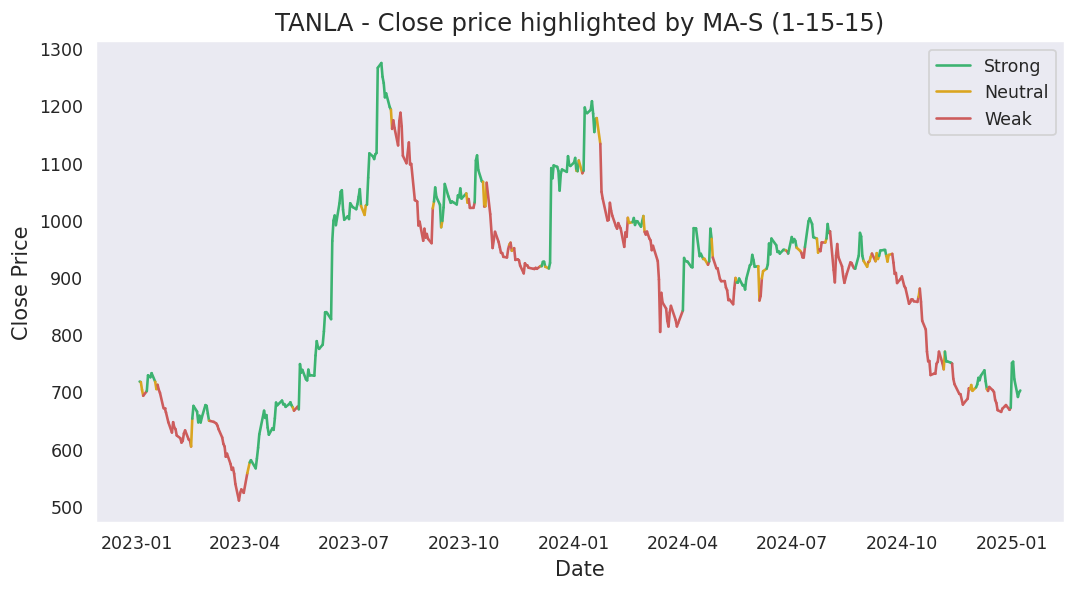
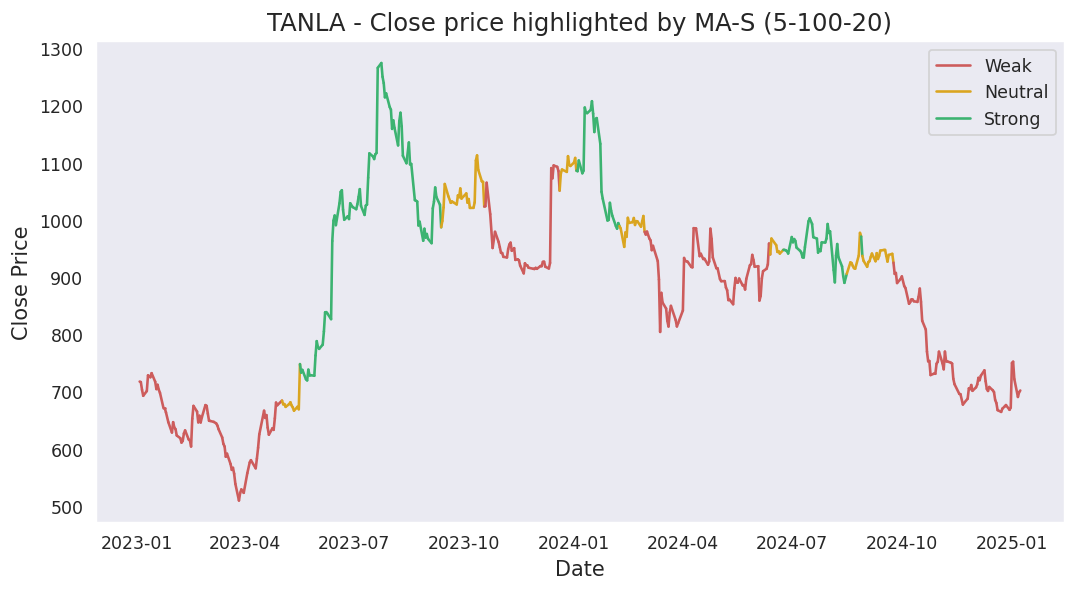
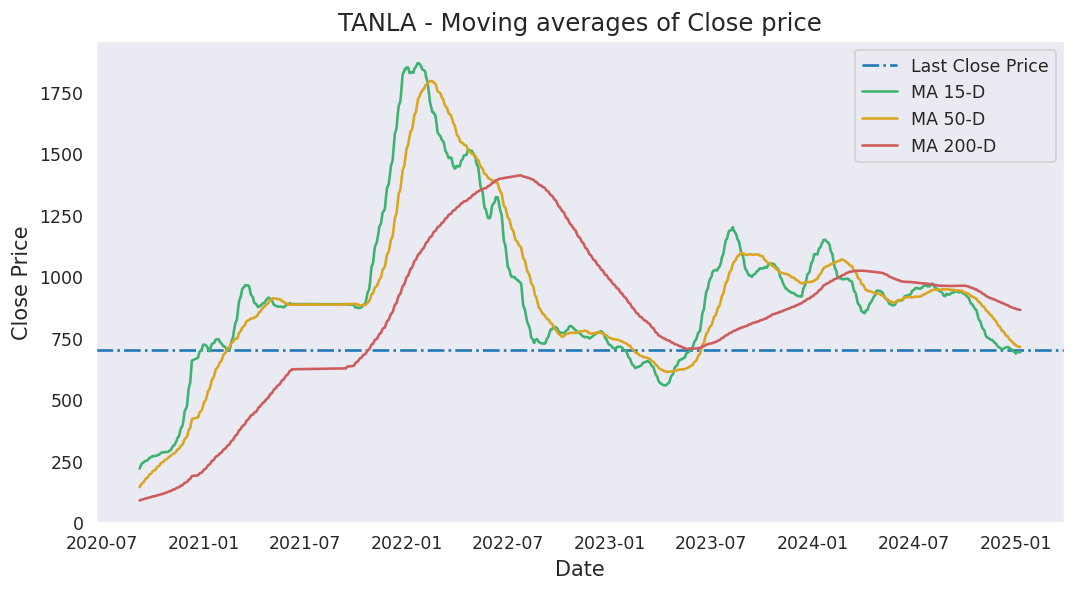
Moving averages
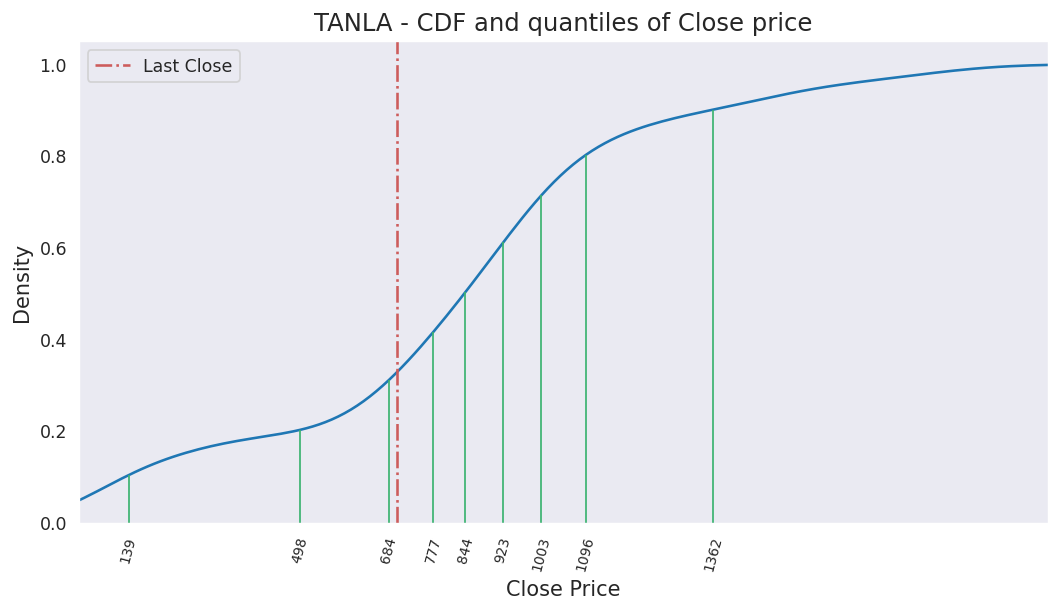
Last close price: 521.35
Average of last 15 days: 519.80
Average of last 50 days: 516.33
Average of last 200 days: 545.94
Analysis based on 1528 records from January 01, 2020 to June 19, 2026
Last updated on June 19, 2026
| 5 Days | 15 Days | 50 Days | 200 Days | 1000 Days | |
|---|---|---|---|---|---|
| Start Date | June 15, 2026 | June 01, 2026 | April 08, 2026 | August 28, 2025 | June 08, 2022 |
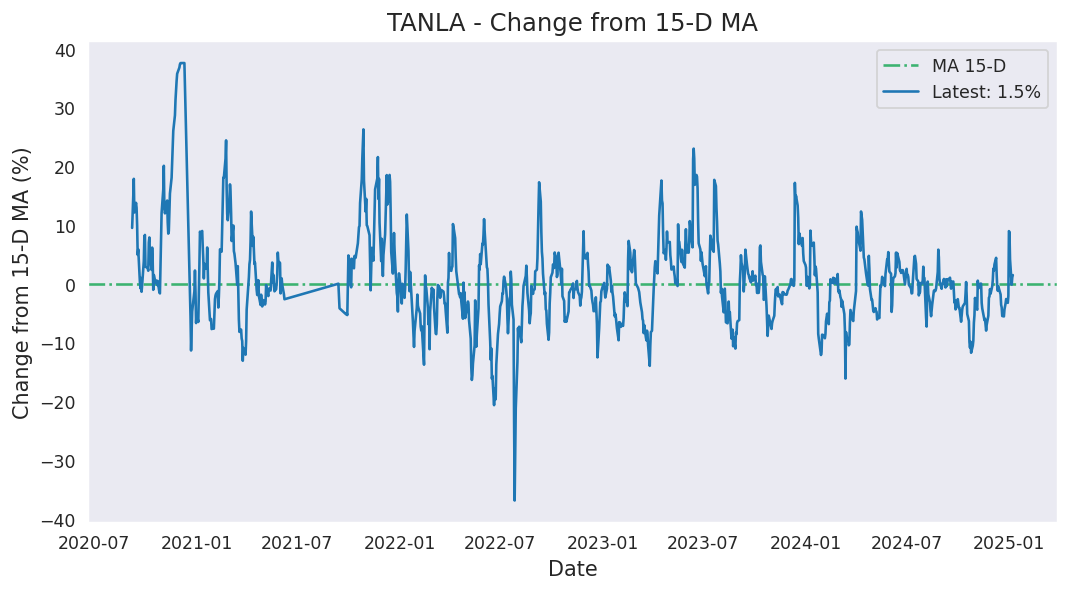
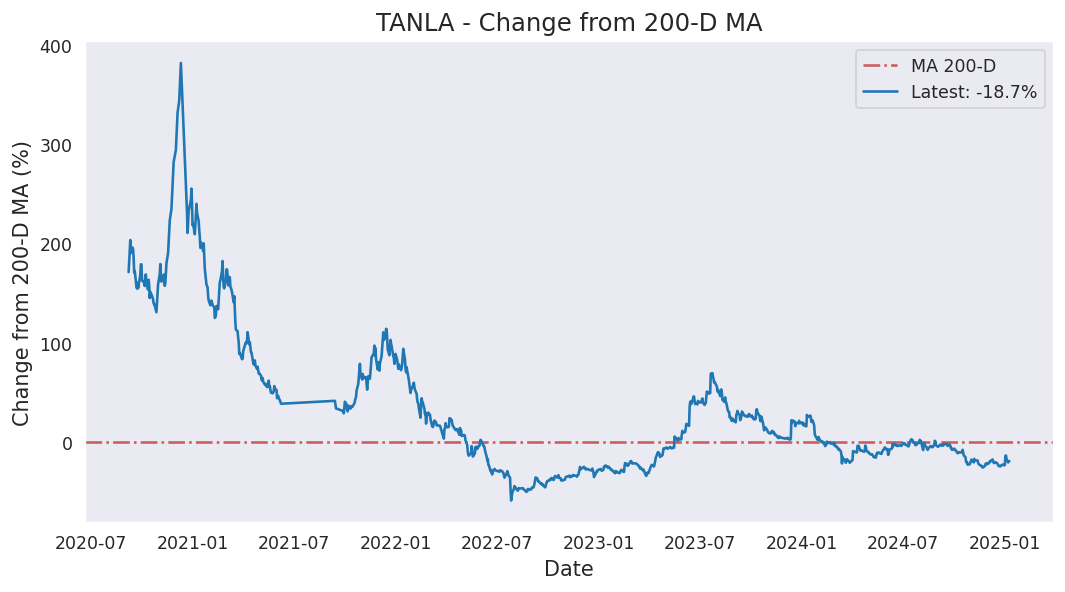
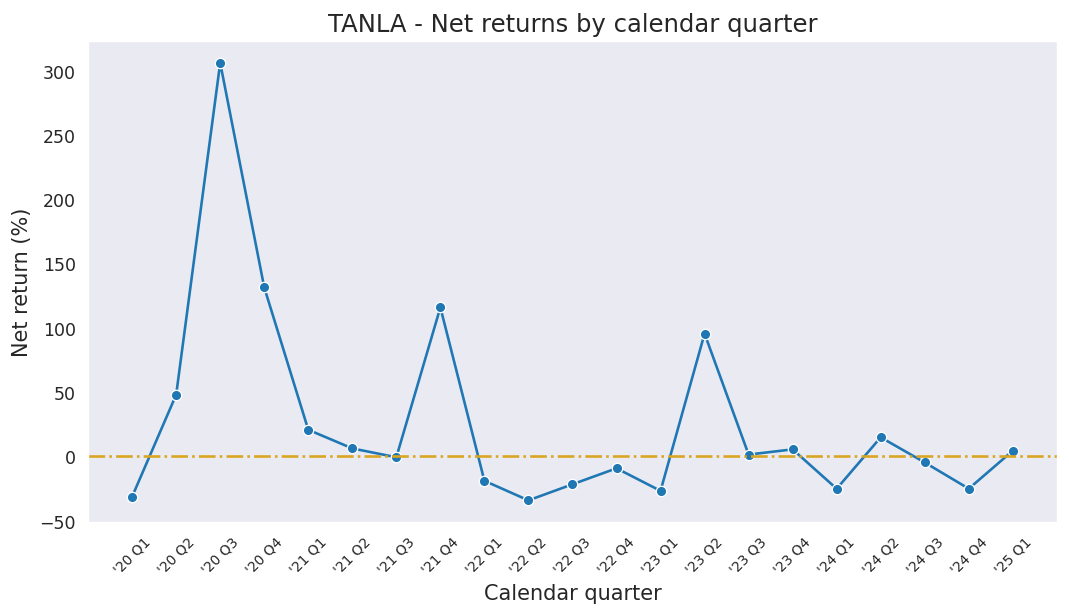
| Net Return | 1.49% | -0.77% | 22.35% | -16.03% | -61.01% |
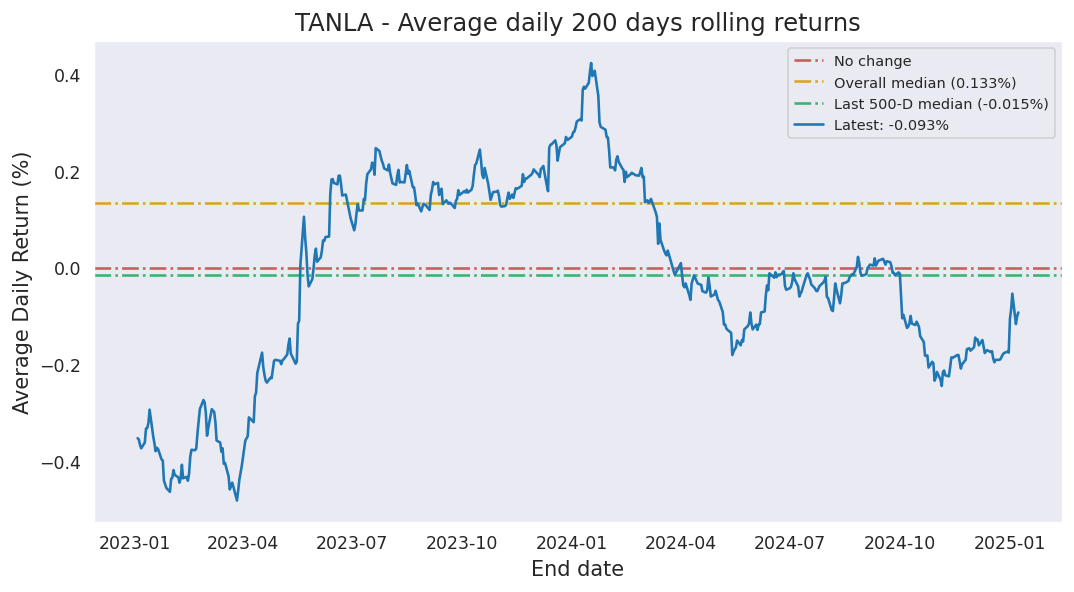
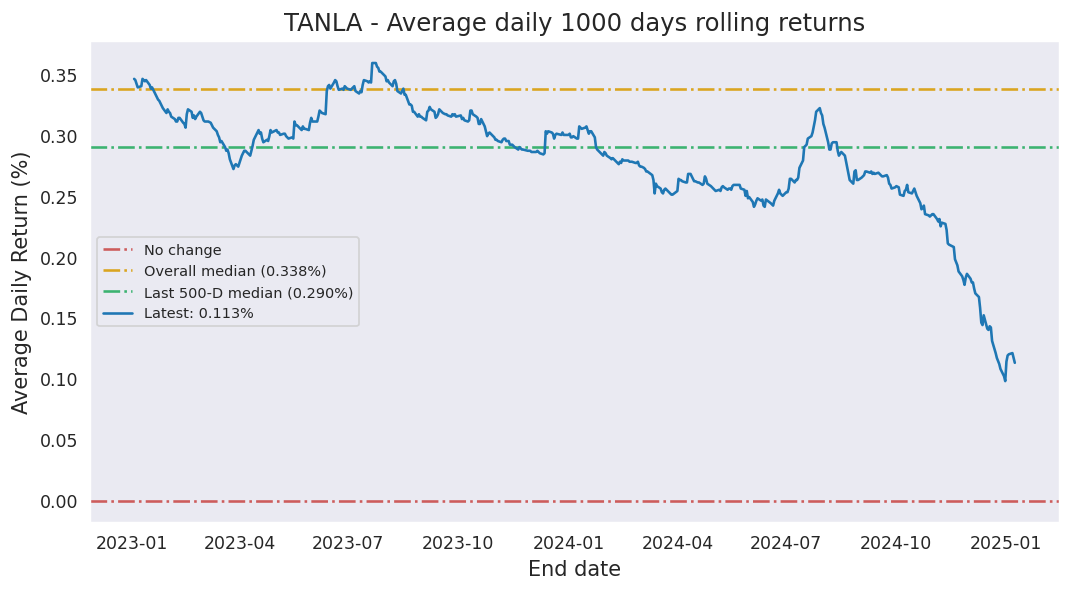
| Average Daily Return | 0.296% | -0.052% | 0.404% | -0.087% | -0.094% |
| Median Close Price | 525.50 | 518.45 | 518.10 | 526.20 | 728.08 |
| Lowest Close Price | 521.35 | 500.65 | 455.40 | 377.45 | 377.45 |
| Highest Close Price | 529.75 | 543.05 | 582.95 | 753.70 | 1339.10 |
| Mean Value Traded | 179.72M | 227.19M | 568.01M | 443.09M | 734.88M |
Last close price: 521.35
Average of last 15 days: 519.80
Average of last 50 days: 516.33
Average of last 200 days: 545.94
TANLA first closed above its last close price on Tuesday, November 24, 2020 which was 2033 days ago.
Since then, it has closed over this price 88.9% of times which is 1157 trading days.
Previously, TANLA closed above its last close price on Thursday, June 18, 2026 which was 1 days ago.
Historically, this stock gave a non-positive return for a maximum period of 2033 days which was from November 24, 2020 to June 19, 2026.
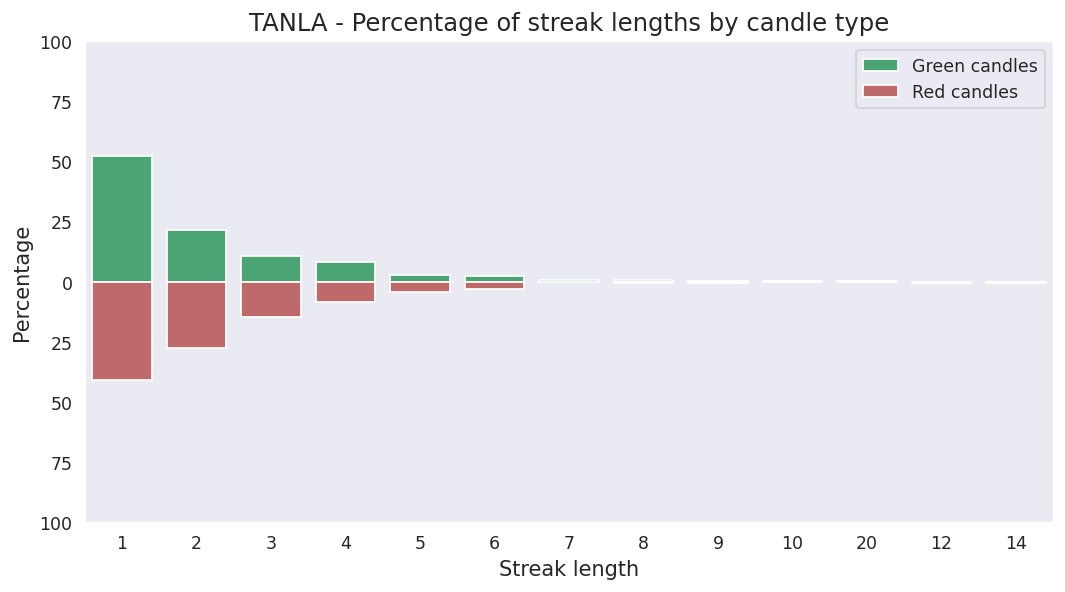
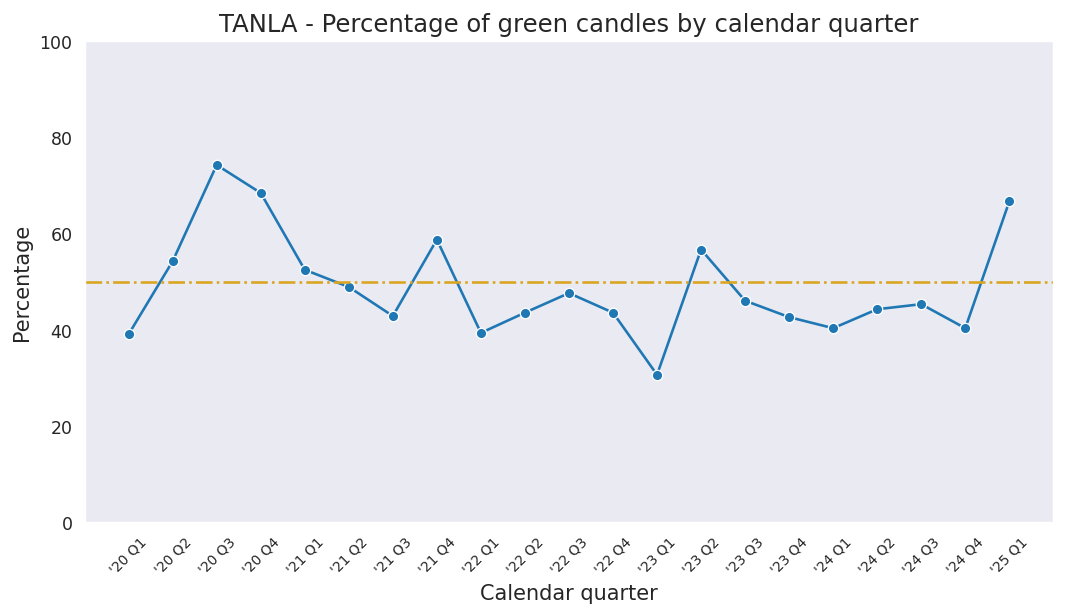
Last candle: Red (-0.79%)
Overall percentage of Red candles: 52.5%
Current streak of Red candles: 3
Net change so far for the current streak: -1.59%
Probability of streak continuing: 53.6%
Longest streak of Red candles: 14 trading days from March 04, 2020 to March 24, 2020
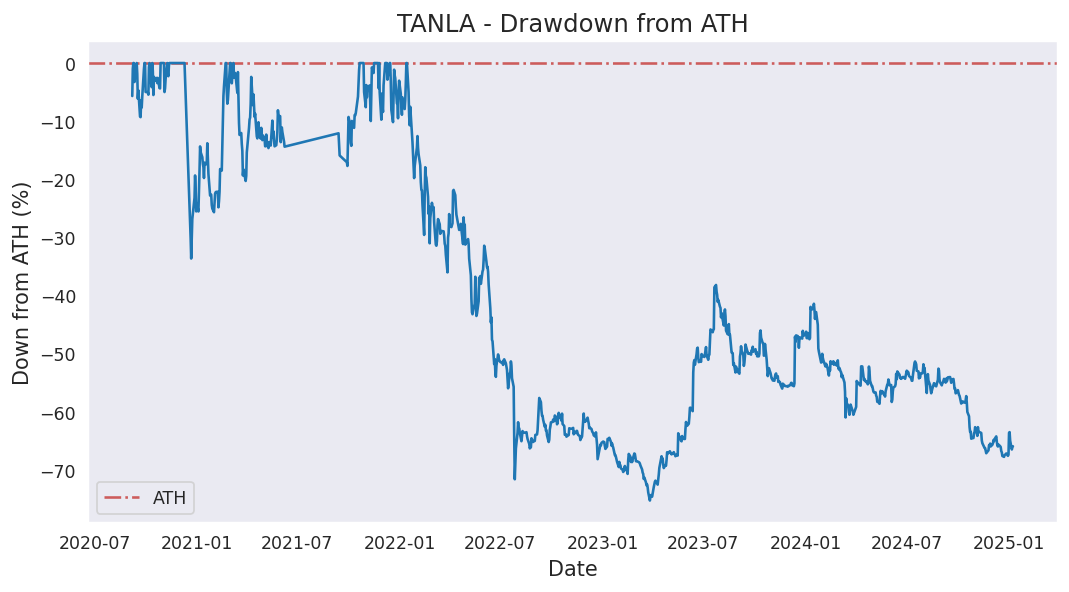
Current down from ATH: -74.71%
Most down from ATH: -81.69%
ATH hits in last 1000 days: 0
ATH was last hit on Friday, January 14, 2022.