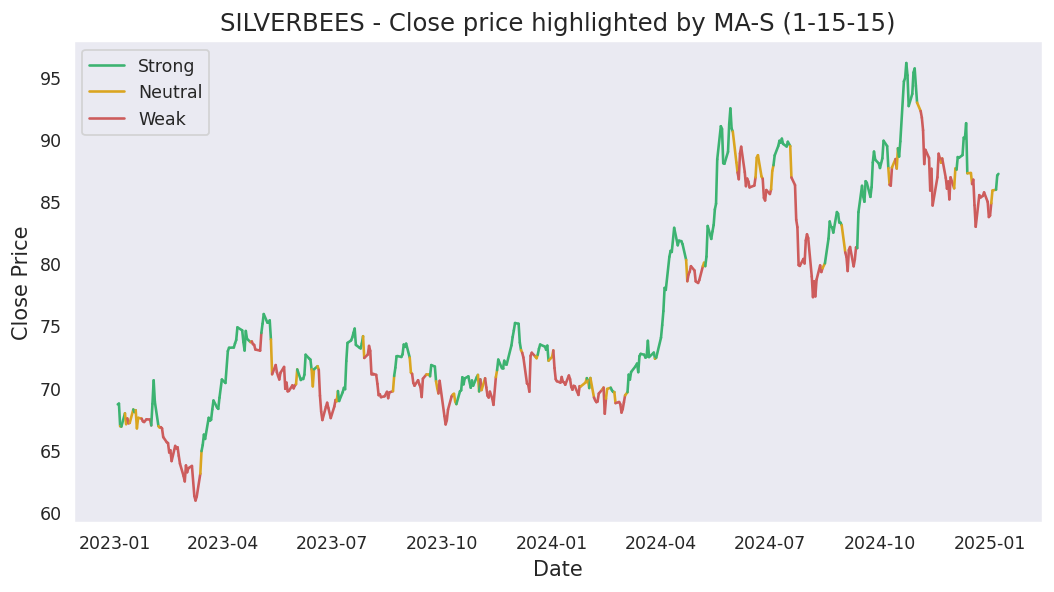
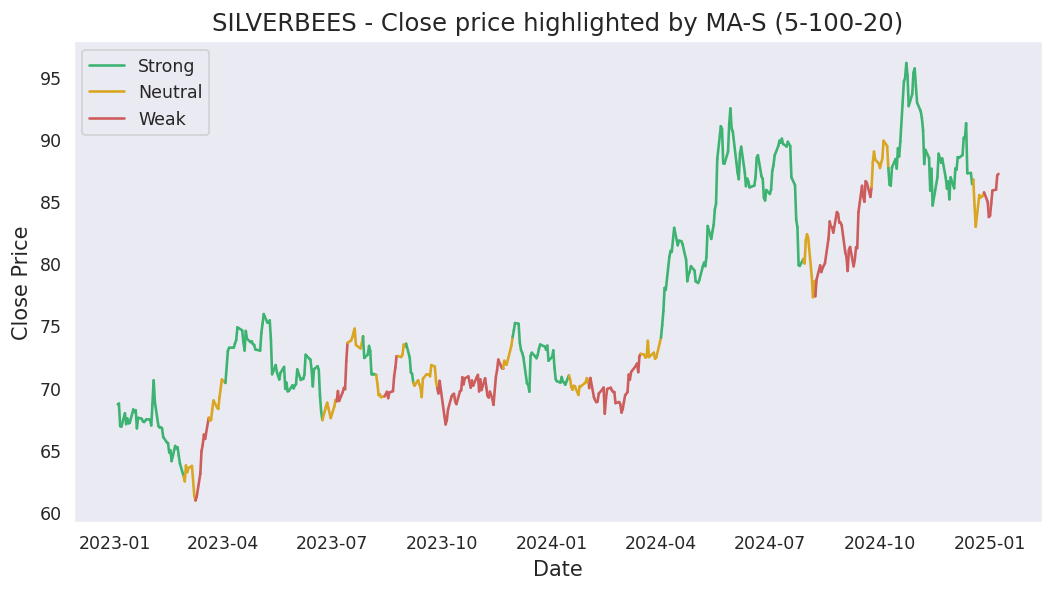
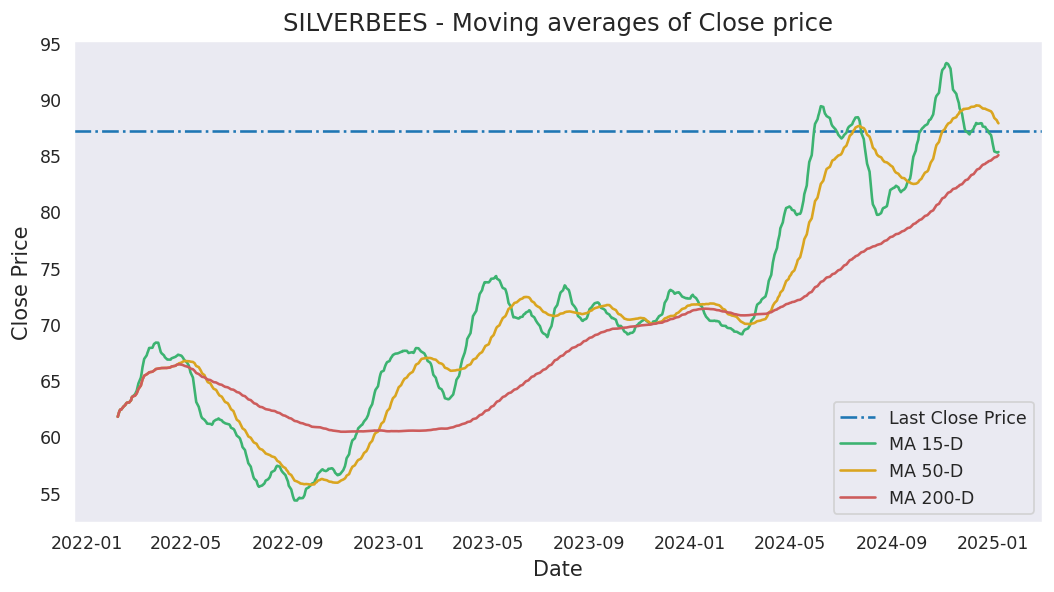
Moving averages
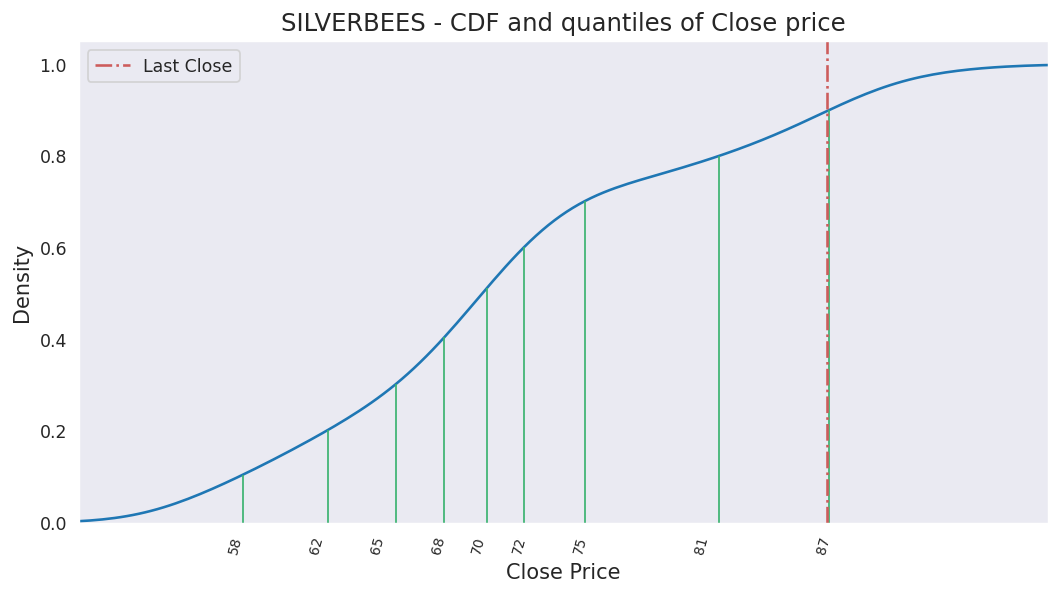
Last close price: 221.42
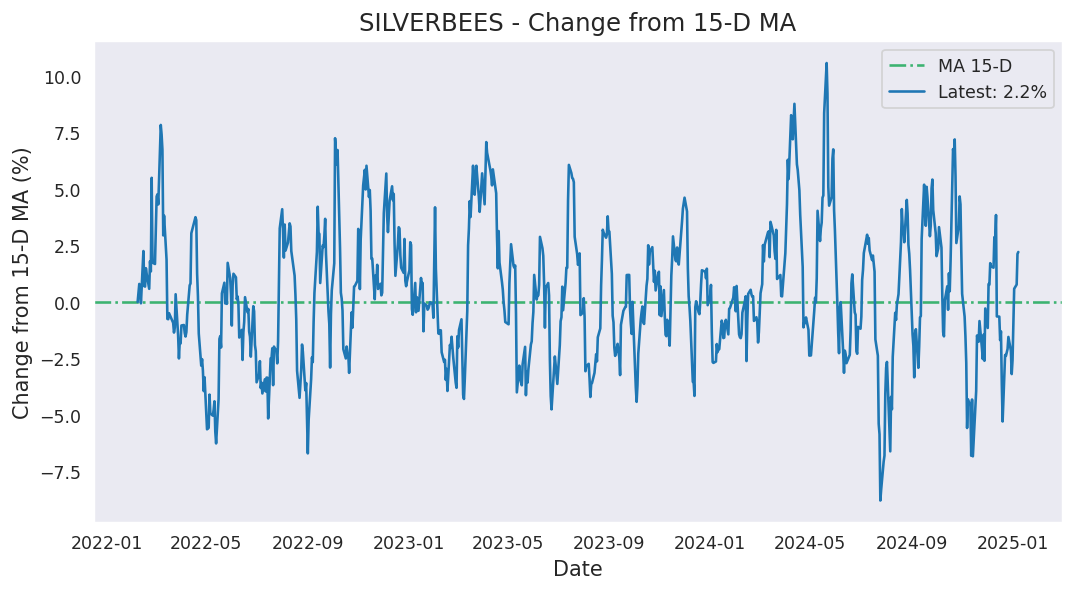
Average of last 15 days: 235.36
Average of last 50 days: 239.00
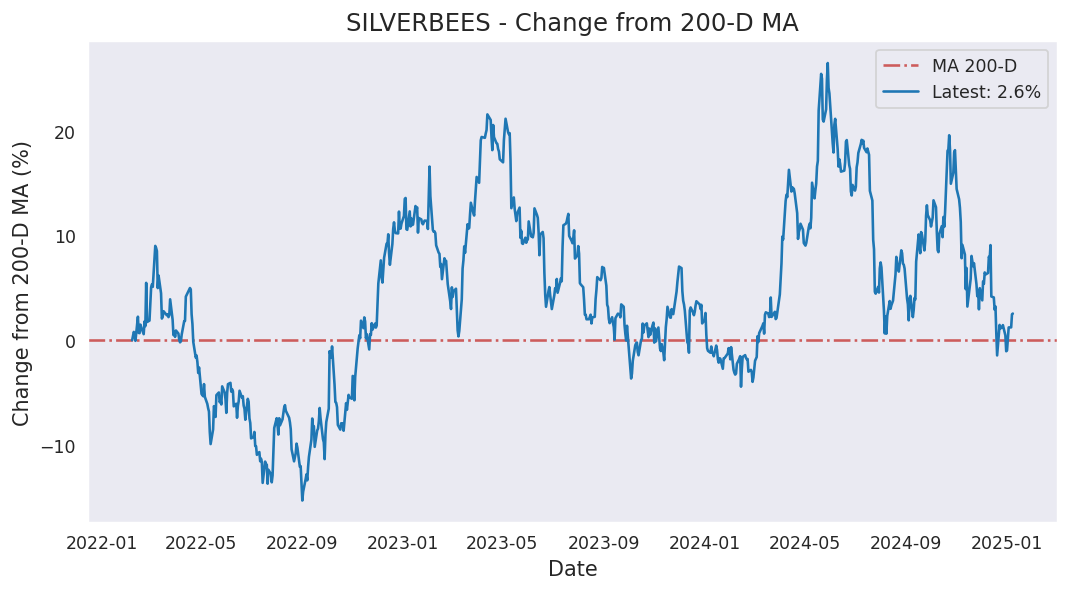
Average of last 200 days: 203.93
Analysis based on 1082 records from February 07, 2022 to June 19, 2026
Last updated on June 19, 2026
| 5 Days | 15 Days | 50 Days | 200 Days | 1000 Days | |
|---|---|---|---|---|---|
| Start Date | June 15, 2026 | June 01, 2026 | April 08, 2026 | August 28, 2025 | June 08, 2022 |
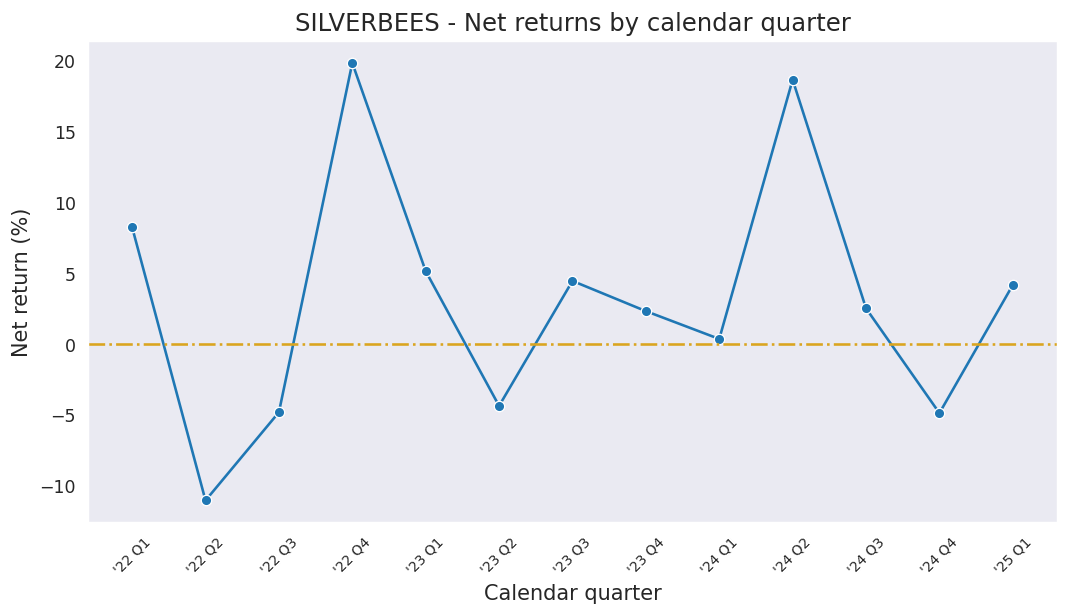
| Net Return | -3.63% | -11.21% | 0.63% | 97.86% | 259.45% |
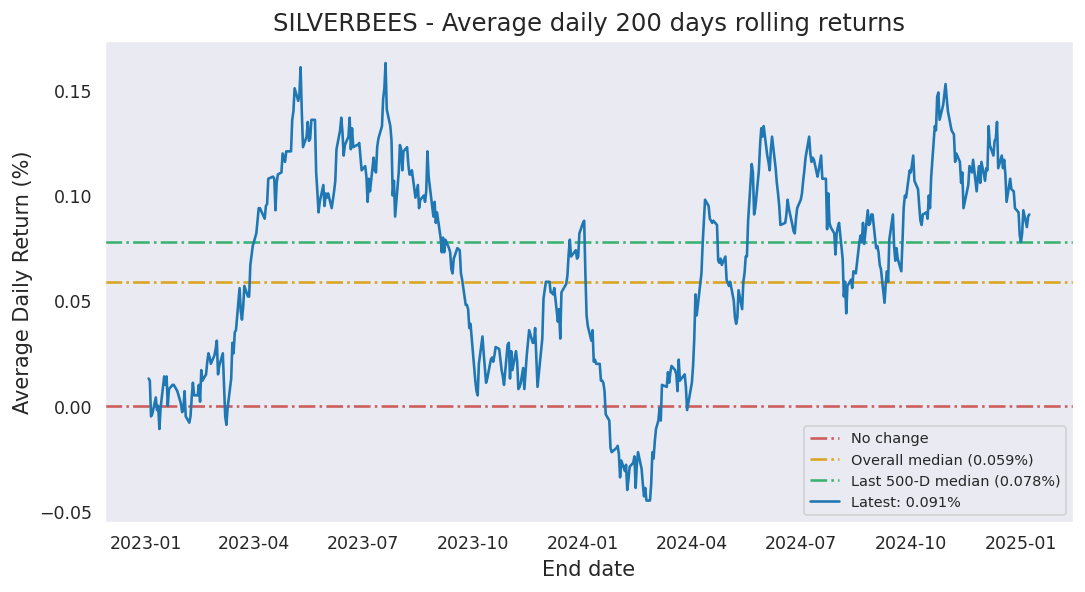
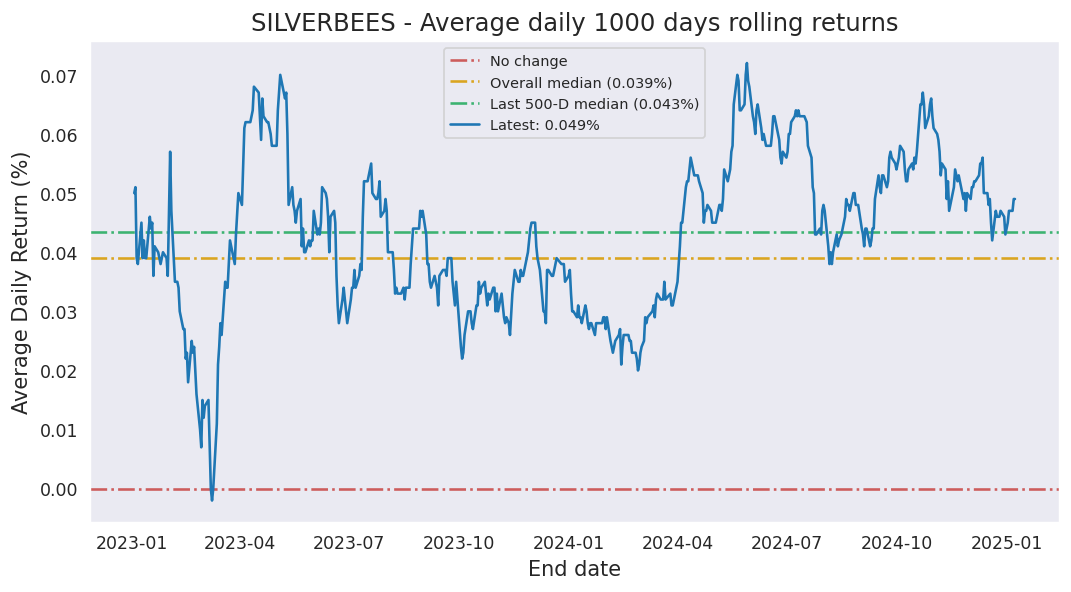
| Average Daily Return | -0.737% | -0.789% | 0.013% | 0.342% | 0.128% |
| Median Close Price | 234.67 | 234.67 | 237.34 | 221.42 | 82.02 |
| Lowest Close Price | 221.42 | 220.59 | 220.59 | 112.78 | 52.27 |
| Highest Close Price | 238.62 | 251.56 | 270.93 | 351.91 | 351.91 |
| Mean Value Traded | 6.58B | 6.34B | 7.42B | 14.26B | 3.18B |
Last close price: 221.42
Average of last 15 days: 235.36
Average of last 50 days: 239.00
Average of last 200 days: 203.93
SILVERBEES first closed above its last close price on Friday, January 02, 2026 which was 168 days ago.
Since then, it has closed over this price 89.4% of times which is 101 trading days.
Previously, SILVERBEES closed above its last close price on Thursday, June 18, 2026 which was 1 days ago.
Historically, this stock gave a non-positive return for a maximum period of 728 days which was from March 07, 2022 to March 04, 2024.
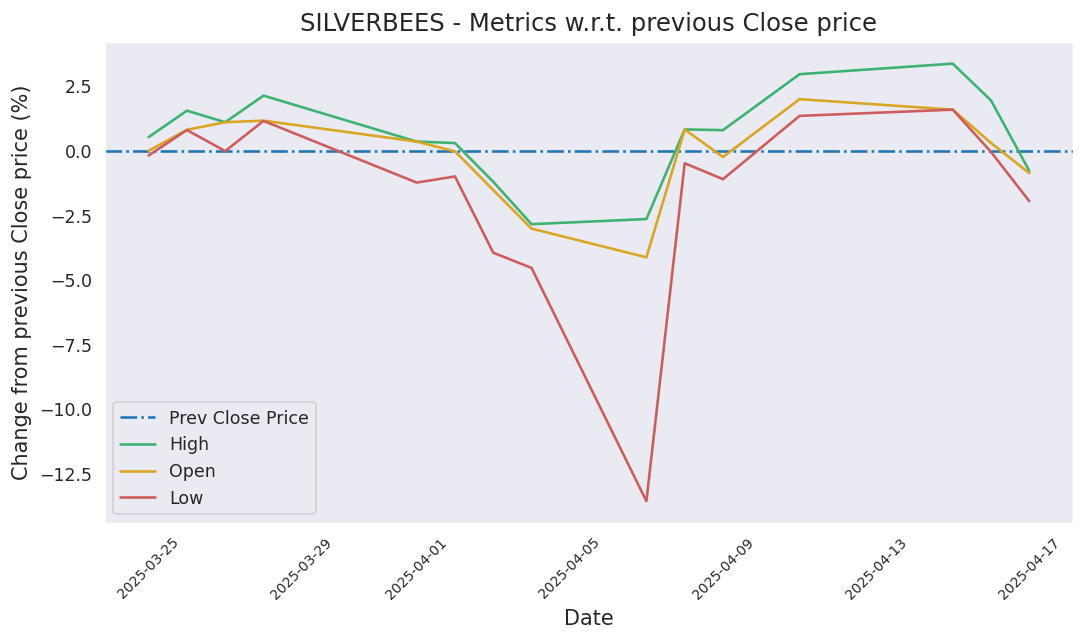
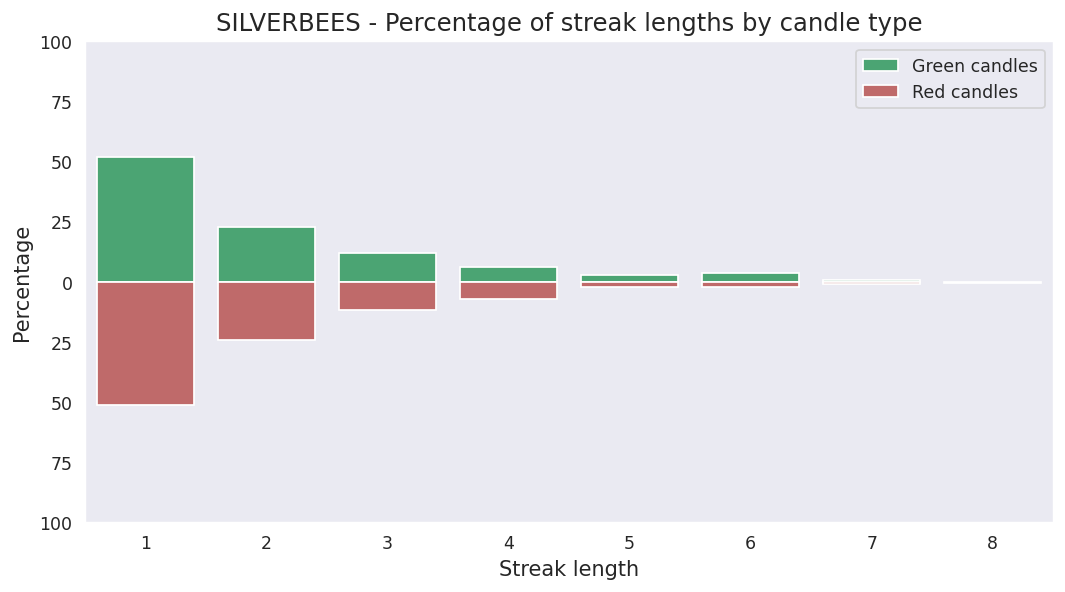
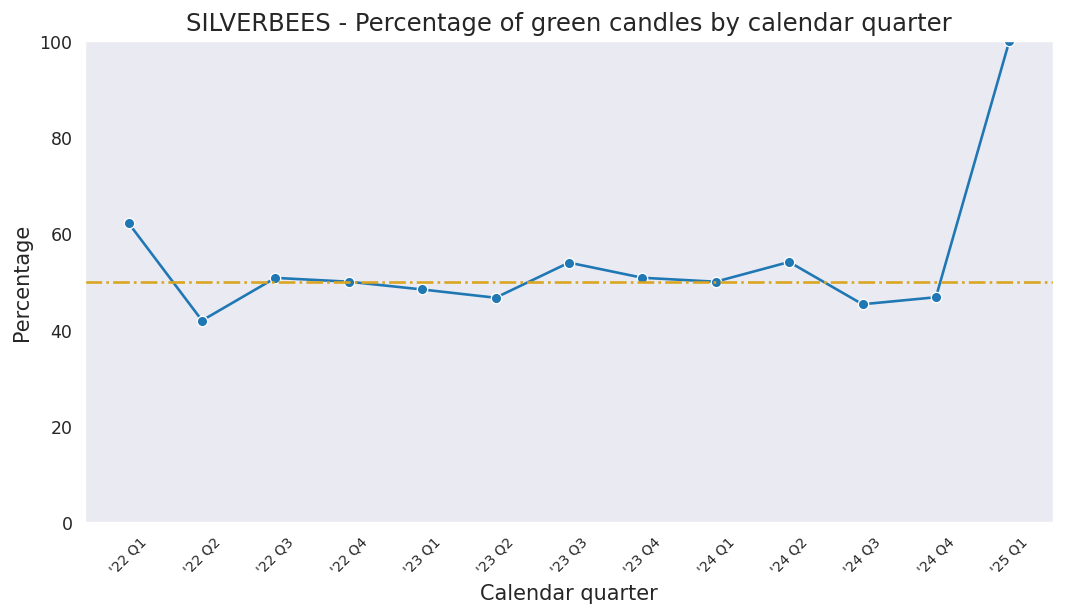
Last candle: Red (-3.73%)
Overall percentage of Red candles: 46.9%
Current streak of Red candles: 4
Net change so far for the current streak: -7.21%
Probability of streak continuing: 38.7%
Longest streak of Red candles: 8 trading days from December 04, 2023 to December 13, 2023
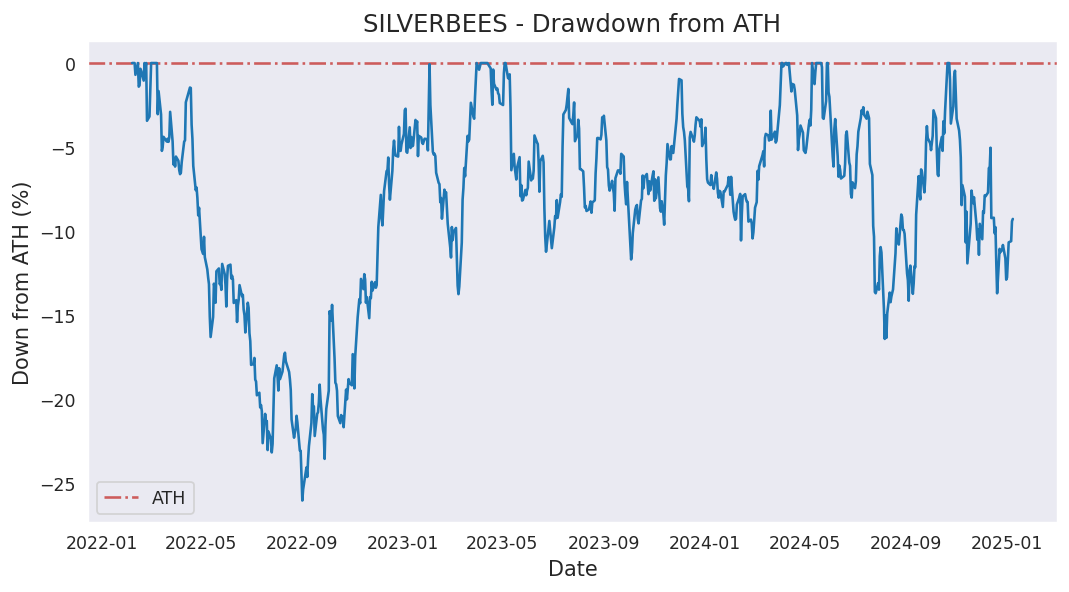
Current down from ATH: -37.08%
Most down from ATH: -45.01%
ATH hits in last 1000 days: 85
ATH was last hit on Thursday, January 29, 2026.