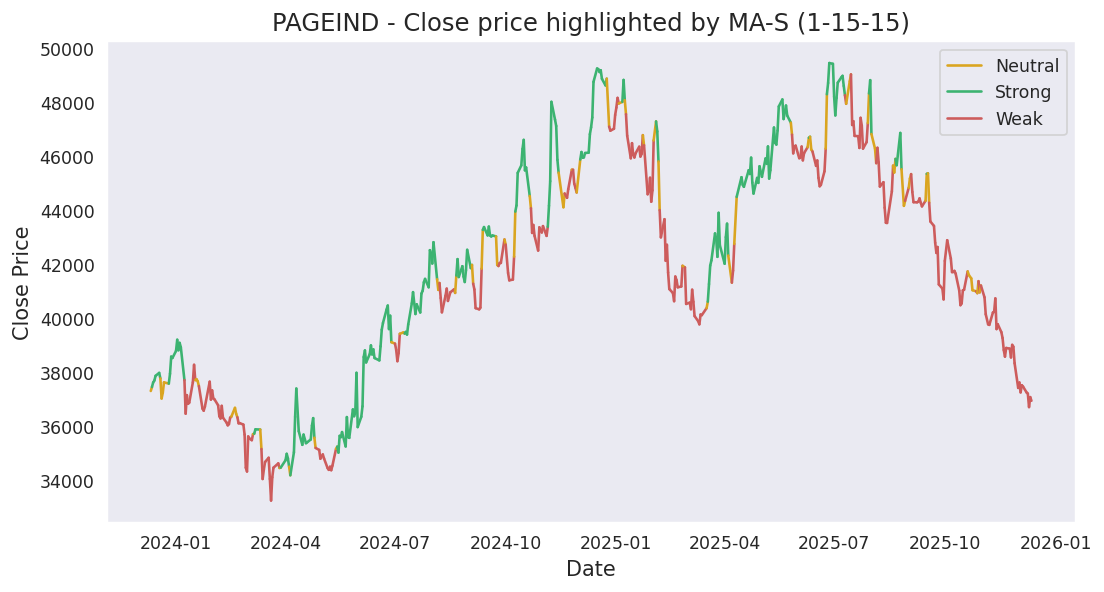
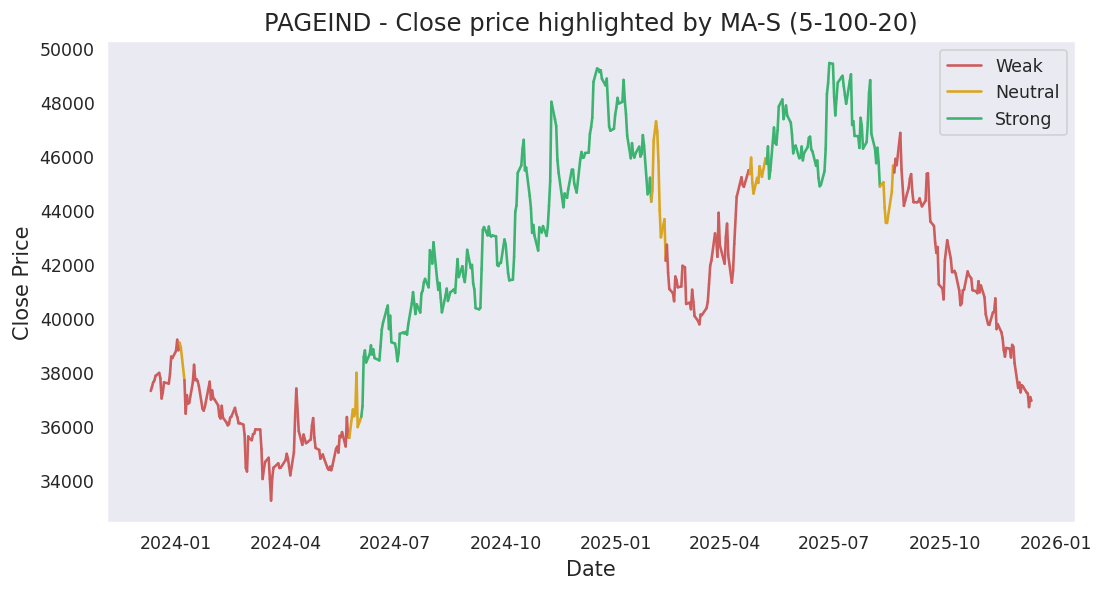
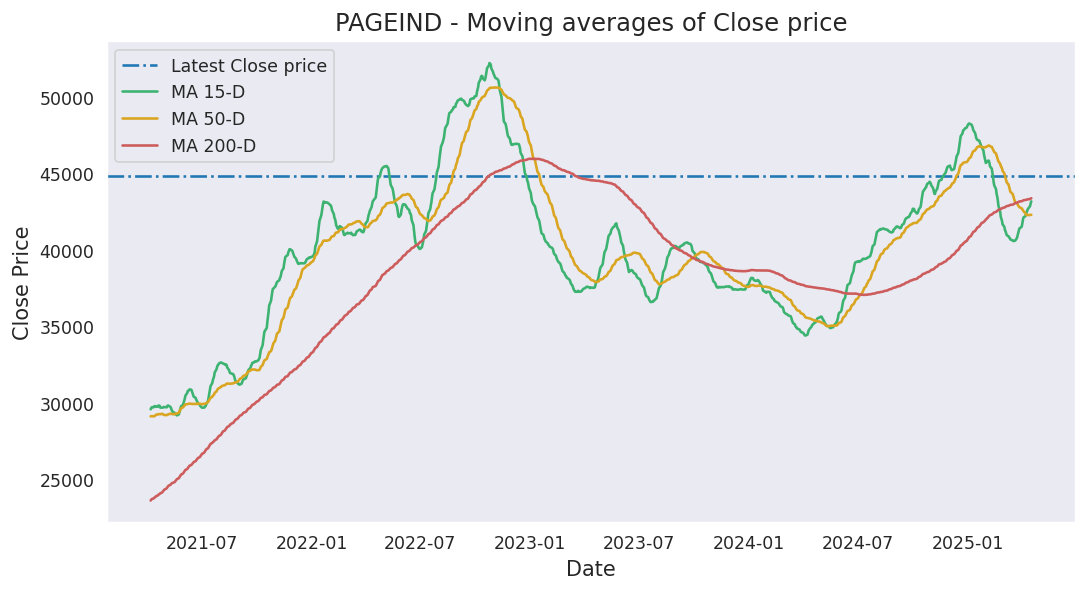
Moving averages
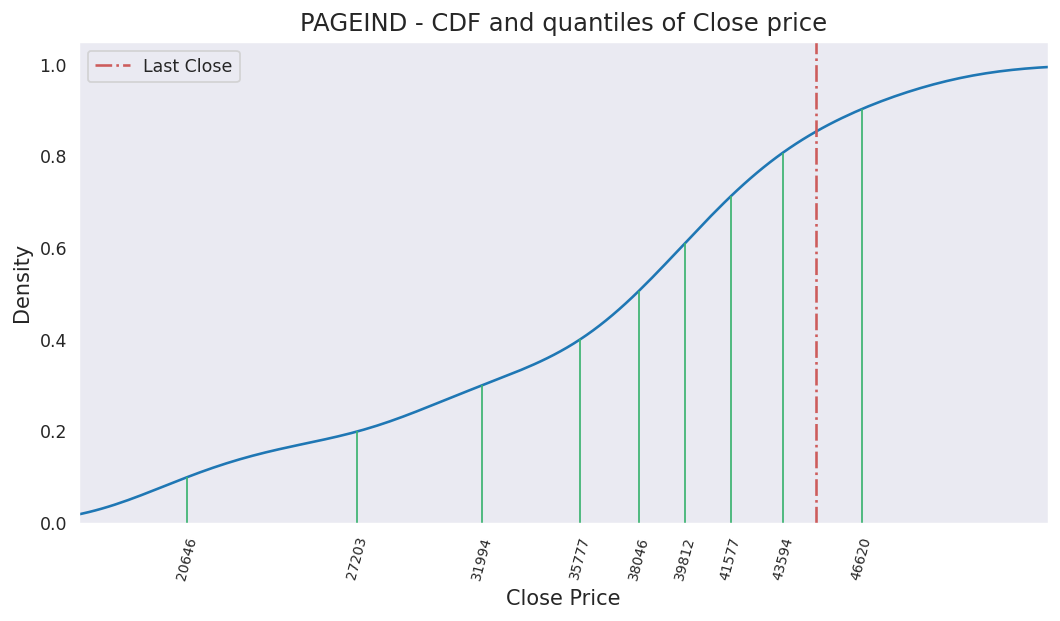
Last close price: 39975.0
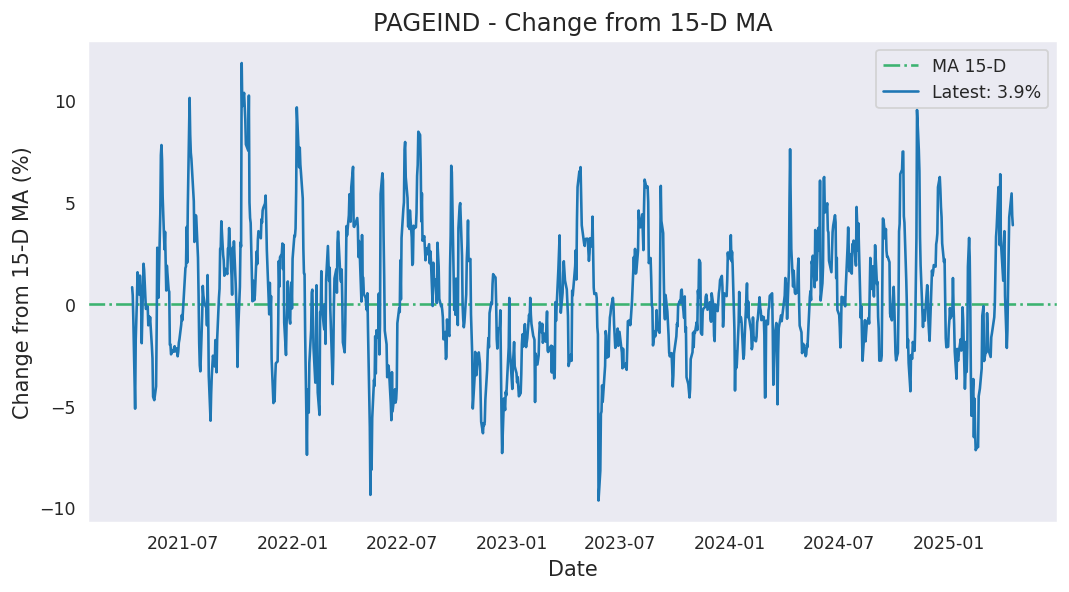
Average of last 15 days: 38588.33
Average of last 50 days: 37678.10
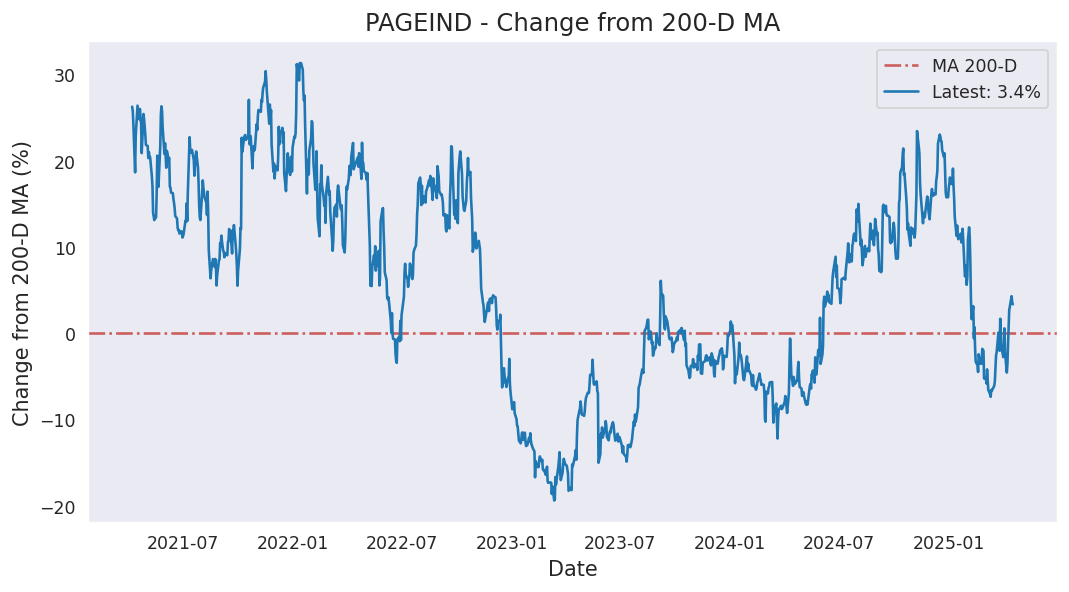
Average of last 200 days: 37403.32
Analysis based on 1606 records from January 01, 2020 to June 19, 2026
Last updated on June 19, 2026
| 5 Days | 15 Days | 50 Days | 200 Days | 1000 Days | |
|---|---|---|---|---|---|
| Start Date | June 15, 2026 | June 01, 2026 | April 08, 2026 | August 28, 2025 | June 08, 2022 |
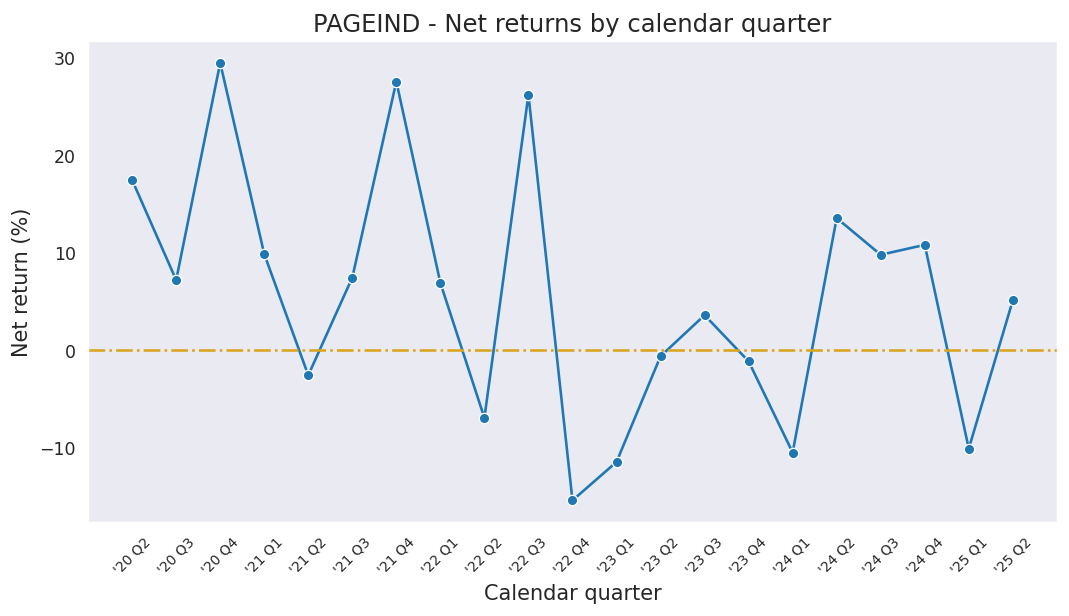
| Net Return | 3.50% | 4.66% | 14.08% | -12.15% | -3.42% |
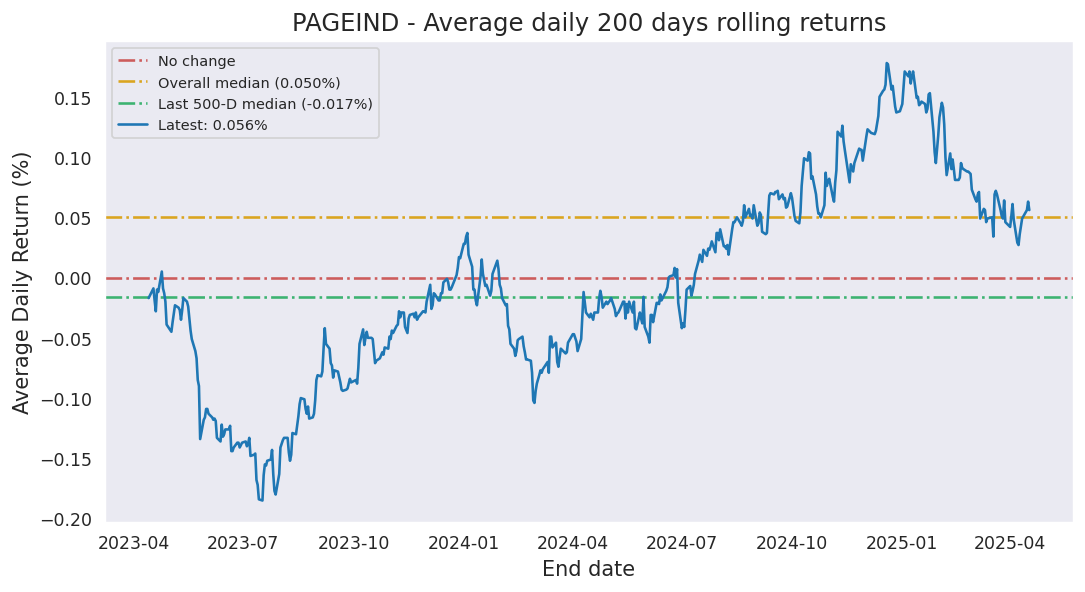
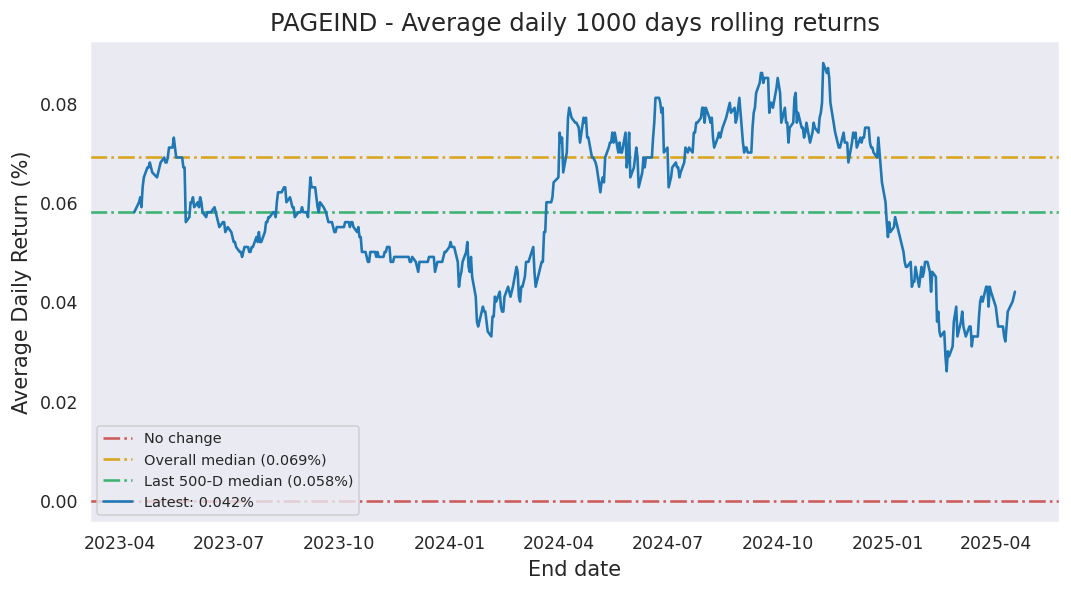
| Average Daily Return | 0.689% | 0.304% | 0.264% | -0.065% | -0.003% |
| Median Close Price | 39300.00 | 38625.00 | 37722.50 | 37382.50 | 40284.80 |
| Lowest Close Price | 39065.00 | 37225.00 | 35085.00 | 30200.00 | 30200.00 |
| Highest Close Price | 40180.00 | 40180.00 | 40180.00 | 45355.00 | 53795.80 |
| Mean Value Traded | 1.28B | 975.85M | 1.11B | 959.62M | 1.04B |
Last close price: 39975.0
Average of last 15 days: 38588.33
Average of last 50 days: 37678.10
Average of last 200 days: 37403.32
PAGEIND first closed above its last close price on Thursday, November 11, 2021 which was 1681 days ago.
Since then, it has closed over this price 56.7% of times which is 648 trading days.
Previously, PAGEIND closed above its last close price on Thursday, June 18, 2026 which was 1 days ago.
Historically, this stock gave a non-positive return for a maximum period of 1874 days which was from February 10, 2021 to March 30, 2026.
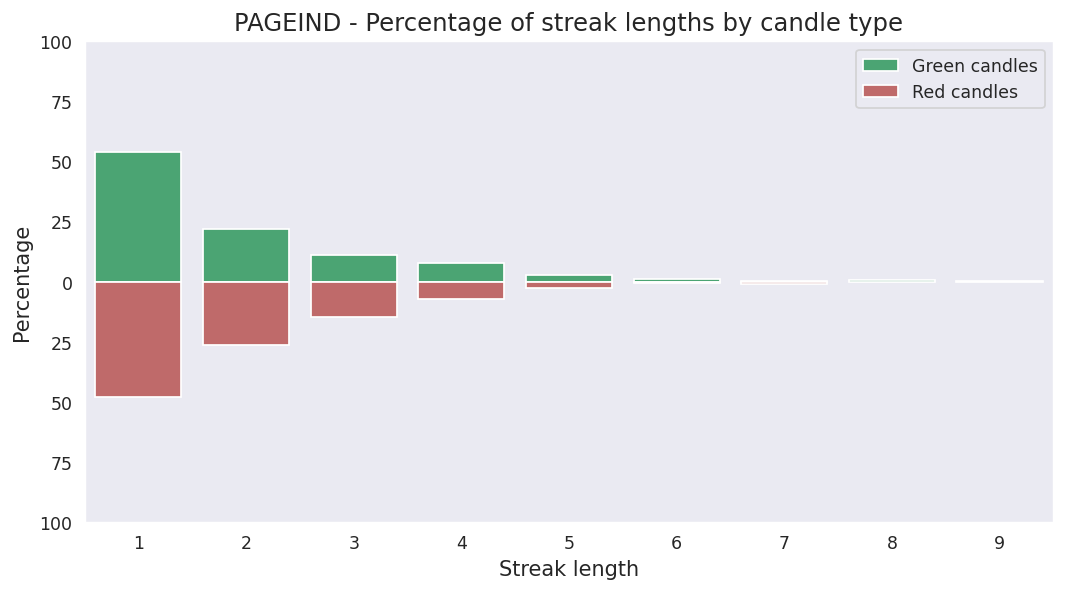
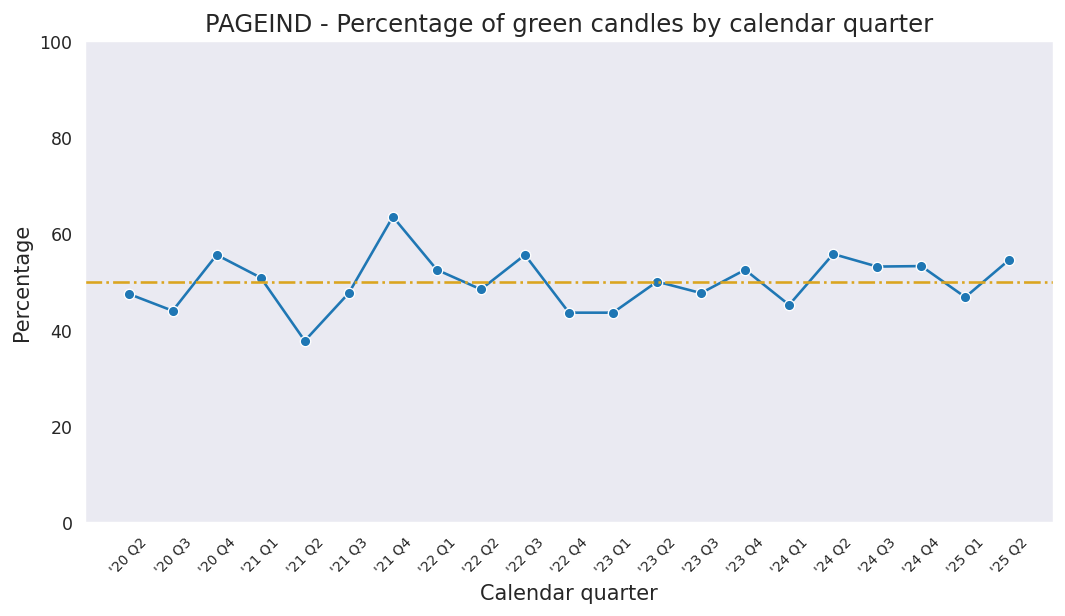
Last candle: Red (-0.51%)
Overall percentage of Red candles: 50.7%
Current streak of Red candles: 1
Net change so far for the current streak: -0.51%
Probability of streak continuing: 53.1%
Longest streak of Red candles: 7 trading days from February 06, 2026 to February 16, 2026
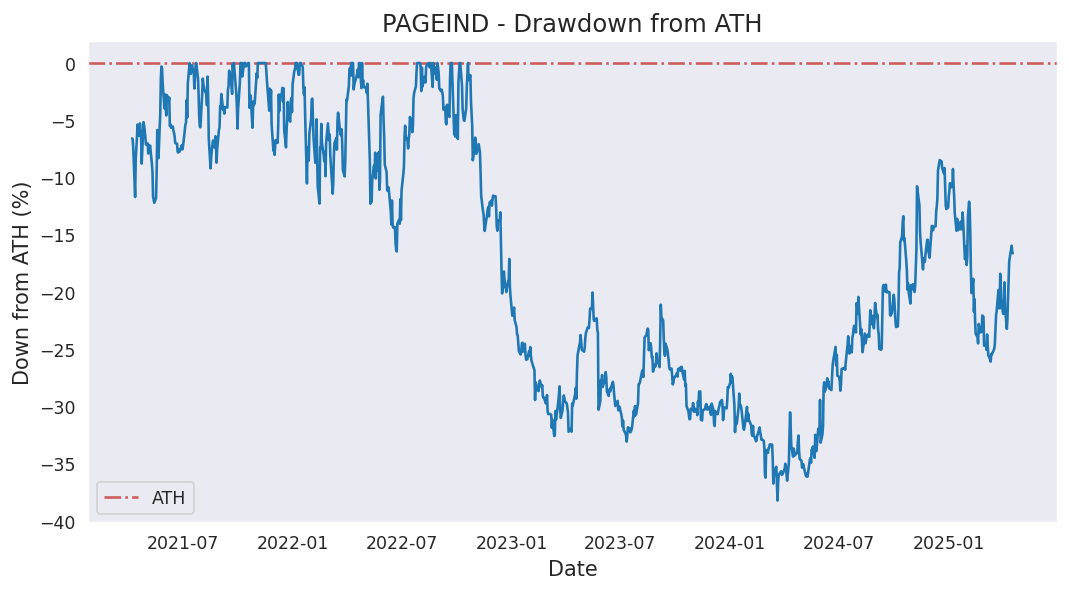
Current down from ATH: -25.69%
Most down from ATH: -43.86%
ATH hits in last 1000 days: 14
ATH was last hit on Thursday, October 20, 2022.