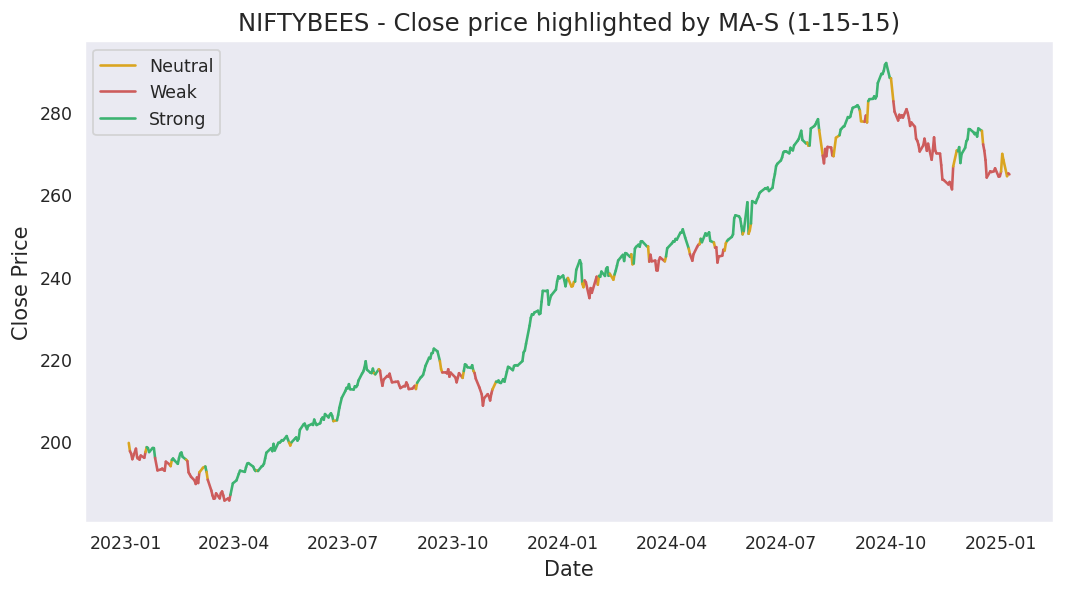
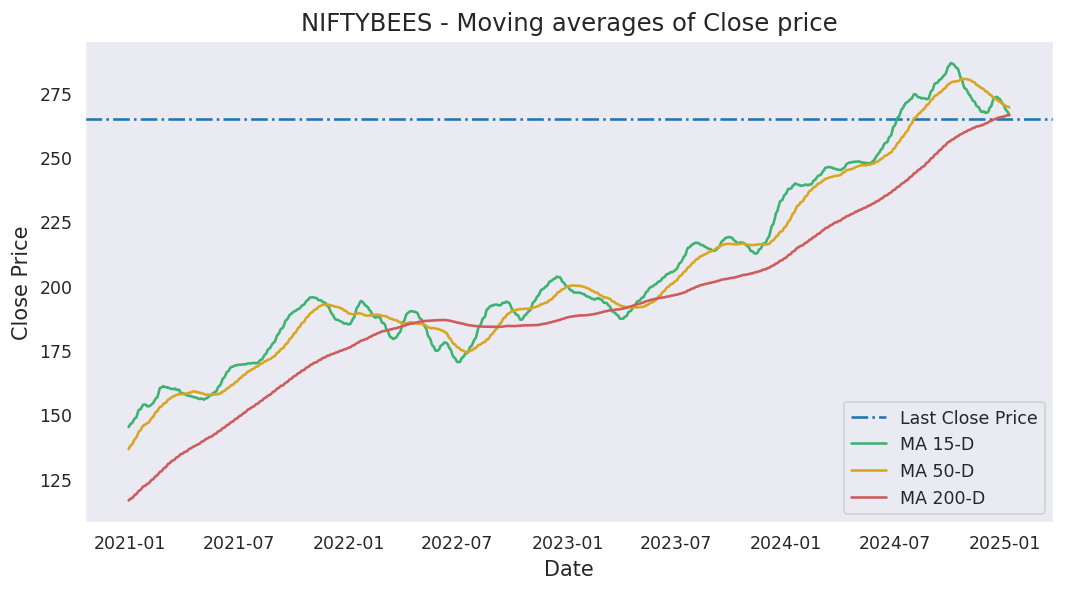
Moving averages
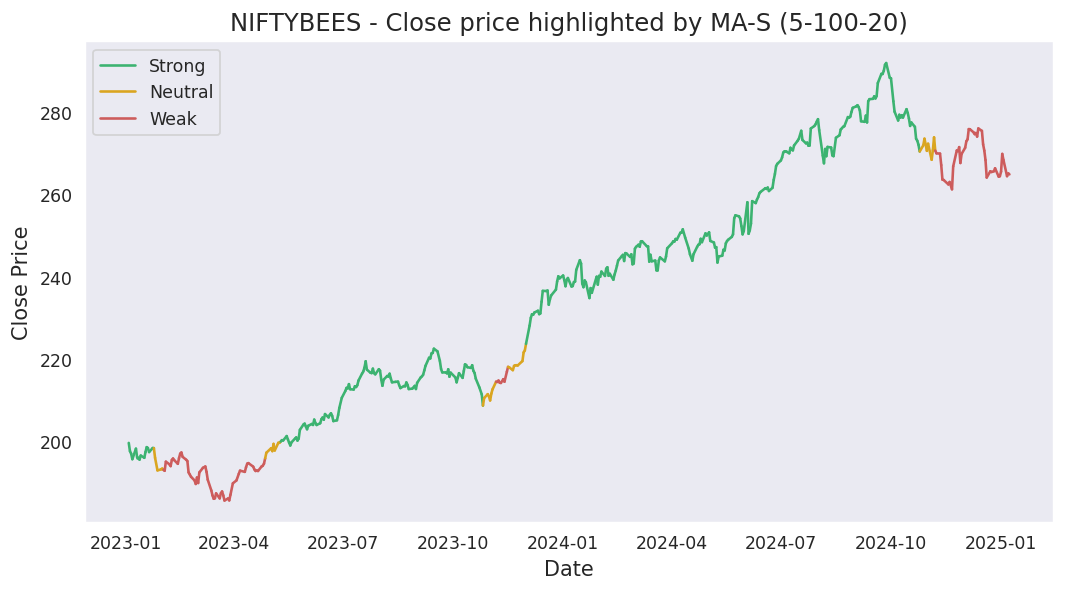
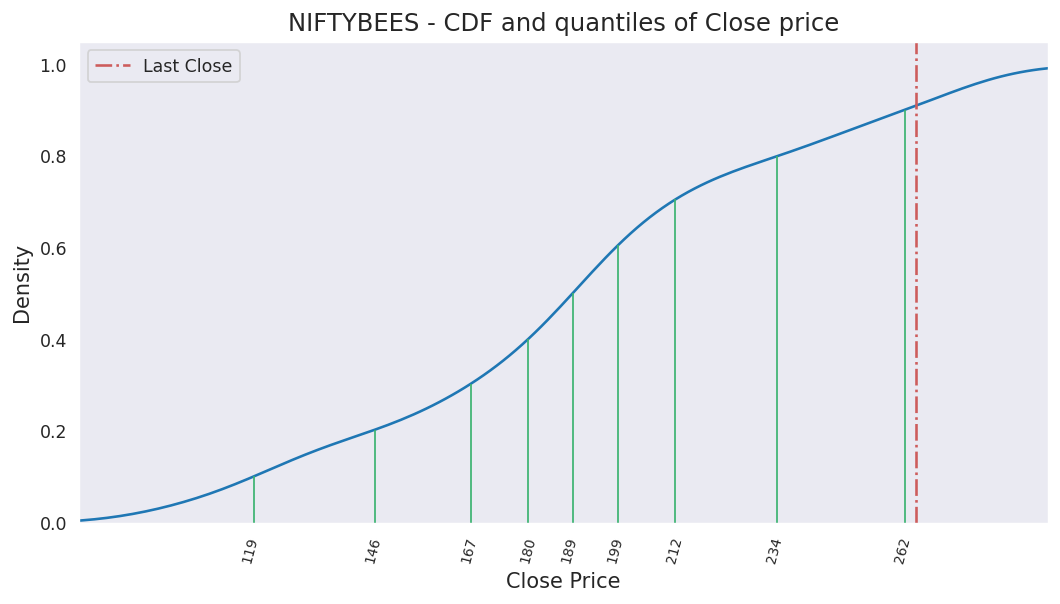
Last close price: 272.95
Average of last 15 days: 267.36
Average of last 50 days: 270.15
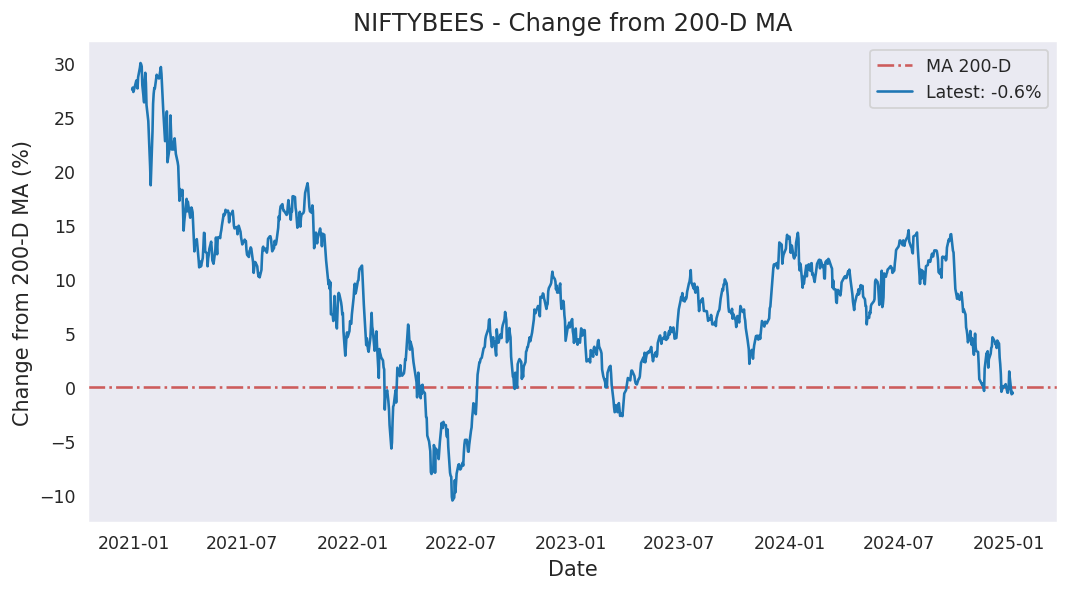
Average of last 200 days: 281.71
Analysis based on 1606 records from January 01, 2020 to June 19, 2026
Last updated on June 19, 2026
| 5 Days | 15 Days | 50 Days | 200 Days | 1000 Days | |
|---|---|---|---|---|---|
| Start Date | June 15, 2026 | June 01, 2026 | April 08, 2026 | August 28, 2025 | June 08, 2022 |
| Net Return | 1.90% | 1.93% | 4.39% | -2.19% | 52.86% |
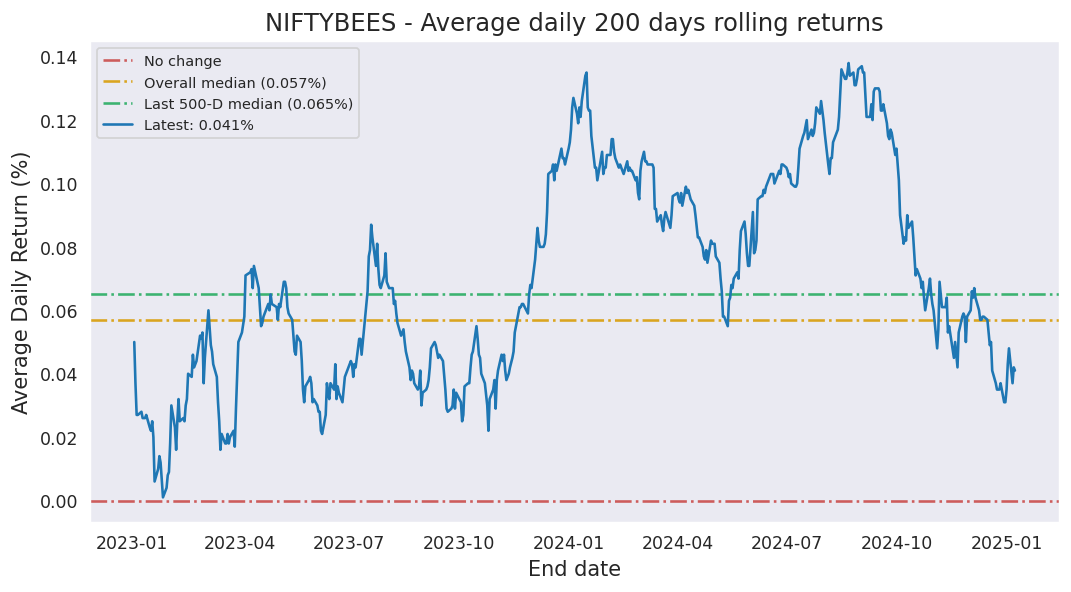
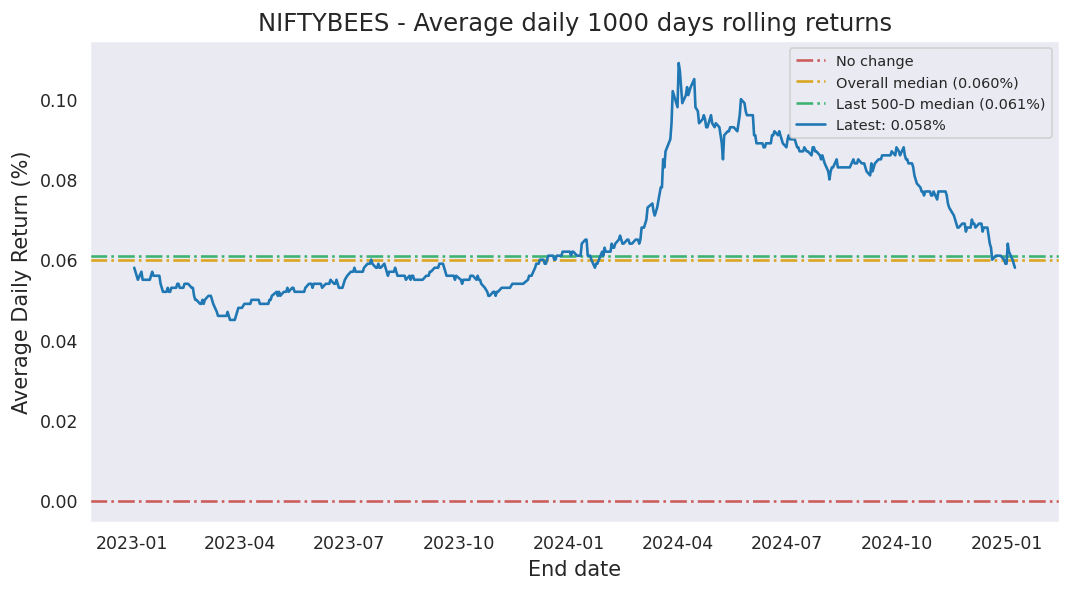
| Average Daily Return | 0.377% | 0.128% | 0.086% | -0.011% | 0.042% |
| Median Close Price | 272.95 | 265.60 | 270.88 | 284.00 | 252.28 |
| Lowest Close Price | 270.63 | 262.56 | 262.56 | 253.44 | 166.87 |
| Highest Close Price | 273.97 | 273.97 | 277.63 | 297.55 | 297.55 |
| Mean Value Traded | 2.22B | 2.16B | 2.44B | 2.21B | 1.23B |
Last close price: 272.95
Average of last 15 days: 267.36
Average of last 50 days: 270.15
Average of last 200 days: 281.71

NIFTYBEES first closed above its last close price on Monday, July 15, 2024 which was 704 days ago.
Since then, it has closed over this price 61.4% of times which is 294 trading days.
Previously, NIFTYBEES closed above its last close price on Thursday, June 18, 2026 which was 1 days ago.
Historically, this stock gave a non-positive return for a maximum period of 716 days which was from June 25, 2024 to June 11, 2026.
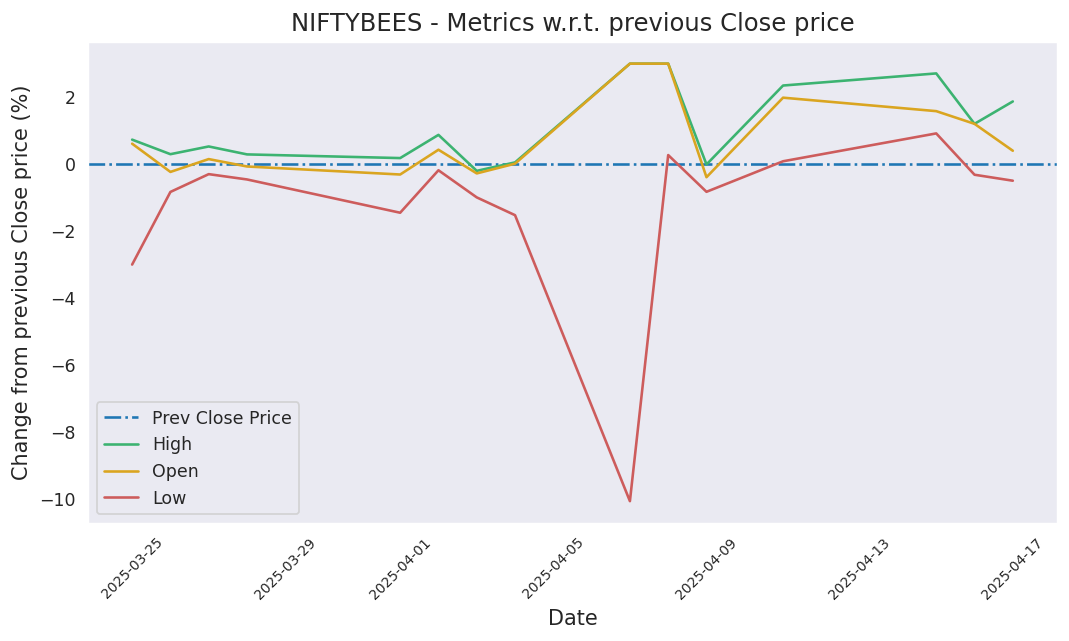
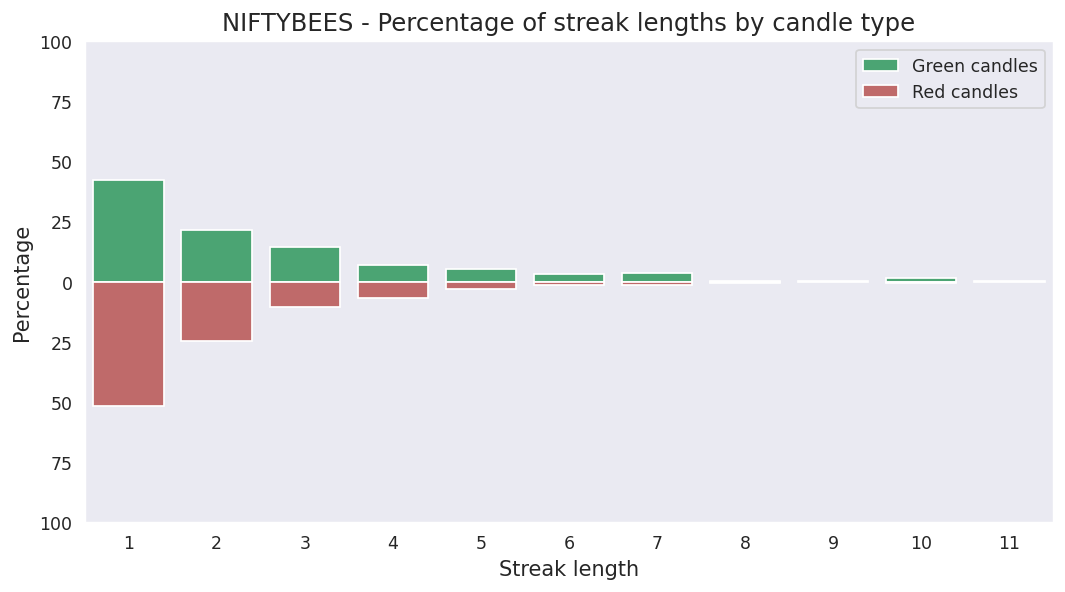
Last candle: Red (-0.37%)
Overall percentage of Red candles: 45.1%
Current streak of Red candles: 1
Net change so far for the current streak: -0.37%
Probability of streak continuing: 50.7%
Longest streak of Red candles: 10 trading days from April 29, 2022 to May 13, 2022
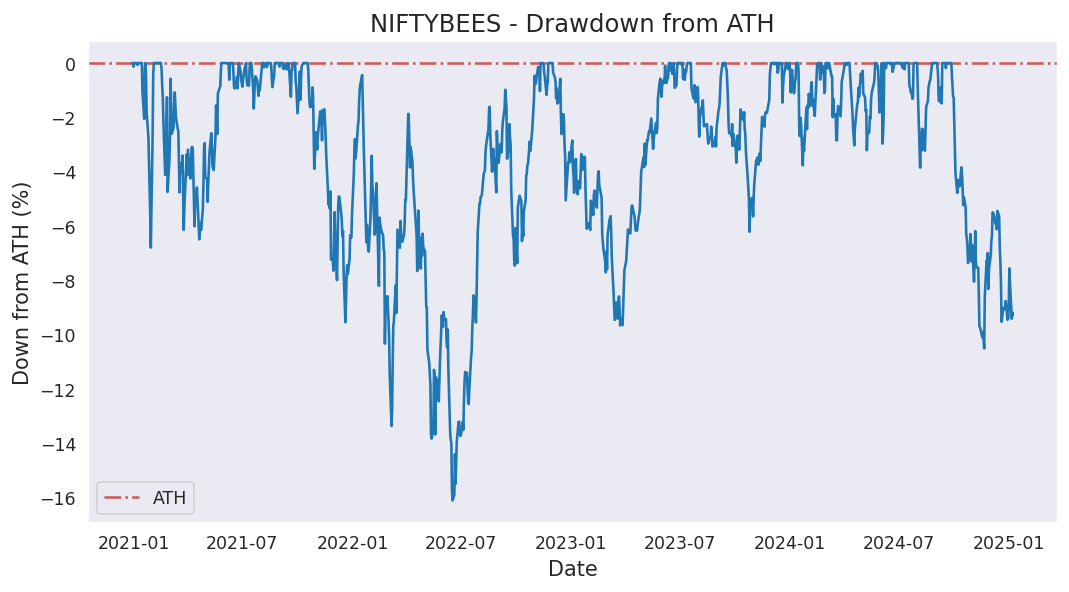
Current down from ATH: -8.27%
Most down from ATH: -36.34%
ATH hits in last 1000 days: 104
ATH was last hit on Friday, January 02, 2026.