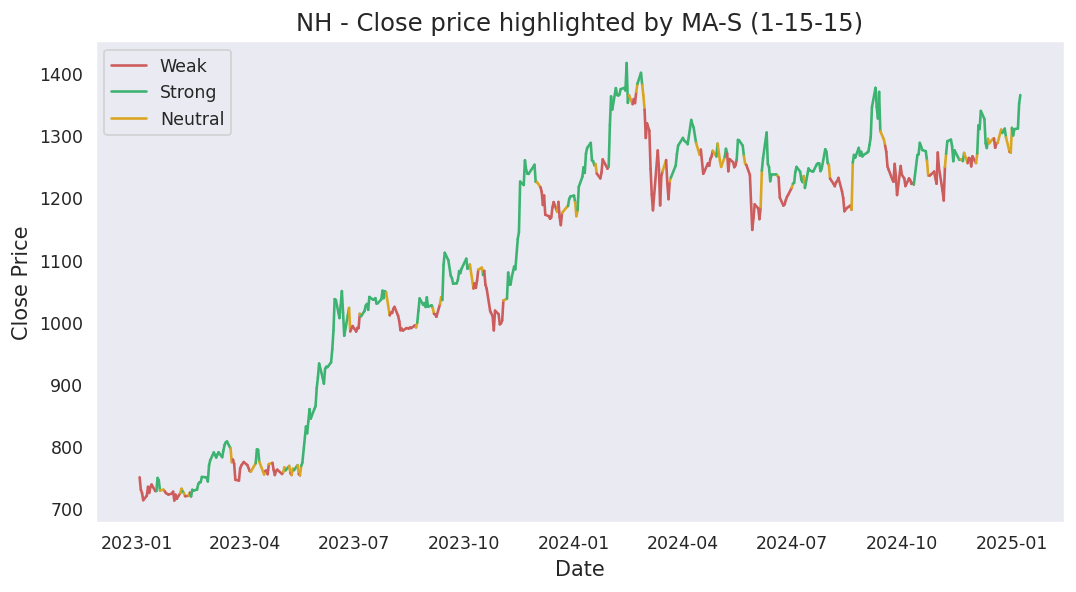
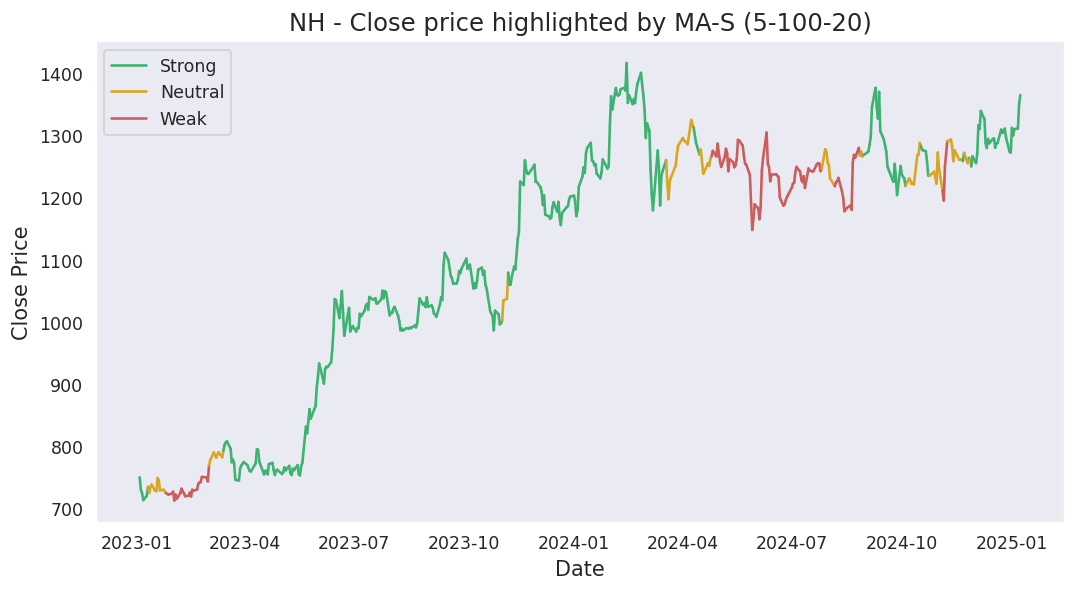
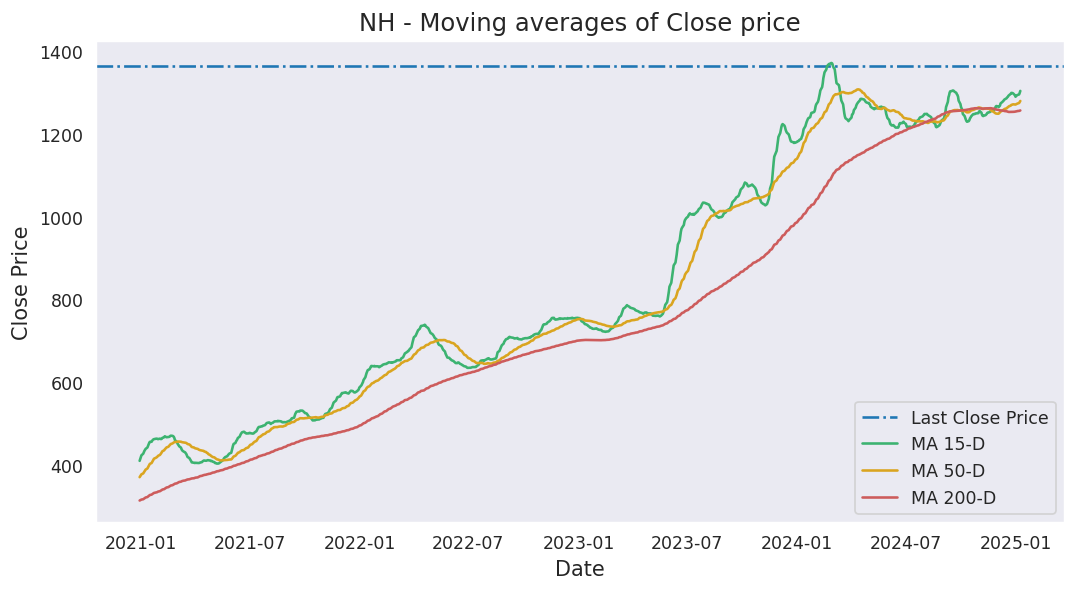
Moving averages
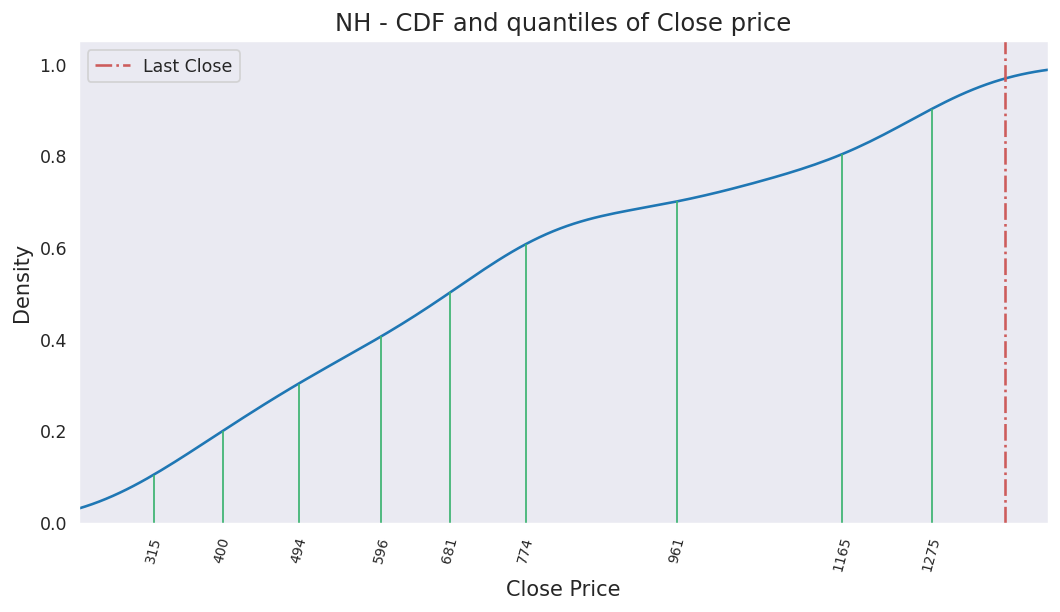
Last close price: 1878.7
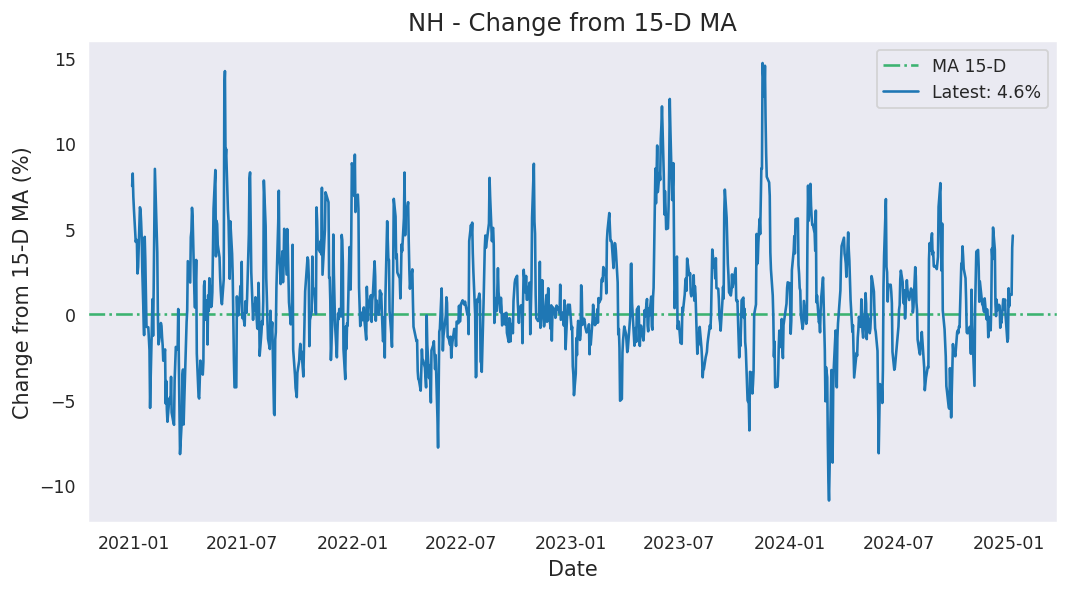
Average of last 15 days: 1905.21
Average of last 50 days: 1847.93
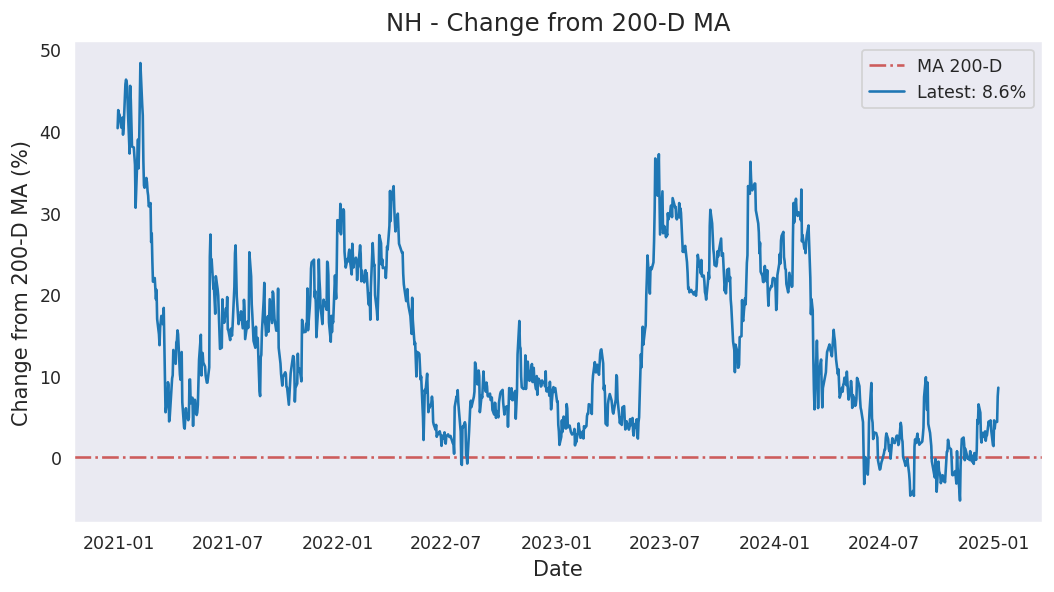
Average of last 200 days: 1816.14
Analysis based on 1606 records from January 01, 2020 to June 19, 2026
Last updated on June 19, 2026
| 5 Days | 15 Days | 50 Days | 200 Days | 1000 Days | |
|---|---|---|---|---|---|
| Start Date | June 15, 2026 | June 01, 2026 | April 08, 2026 | August 28, 2025 | June 08, 2022 |
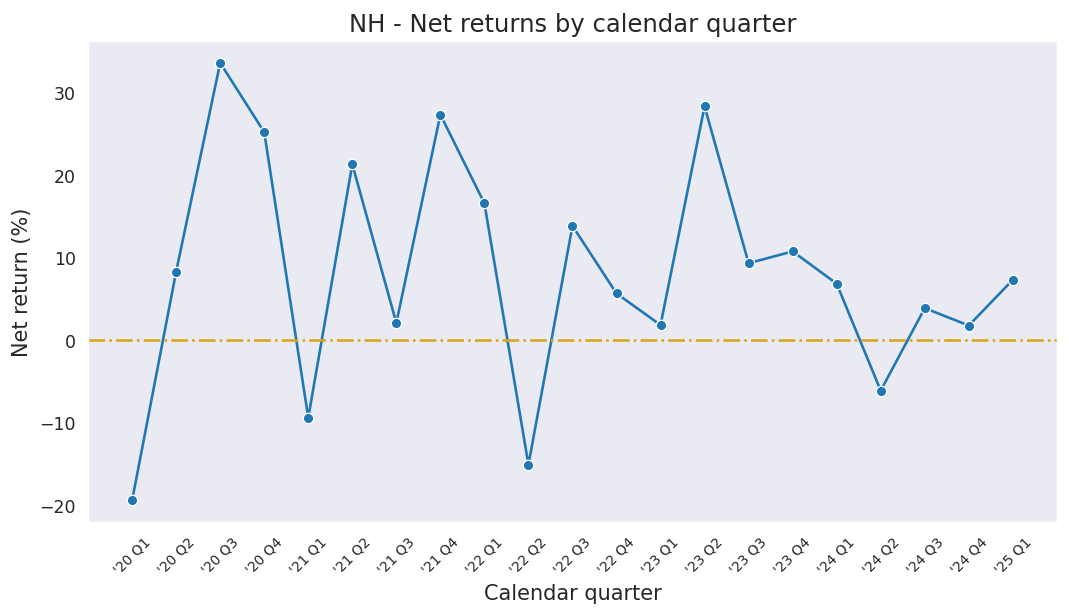
| Net Return | -0.80% | -0.81% | 10.51% | 5.71% | 185.93% |
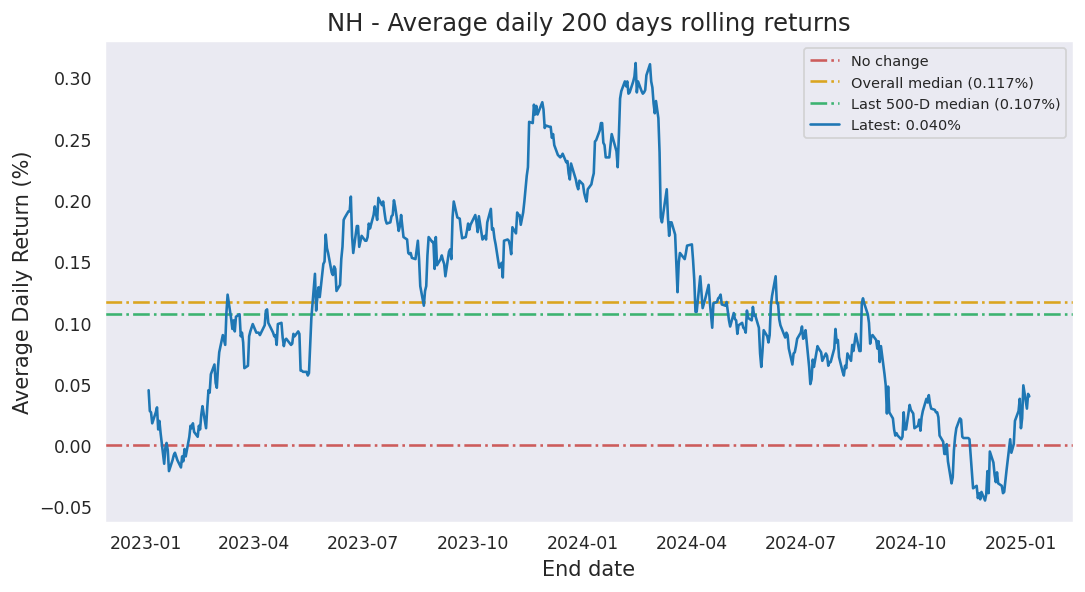
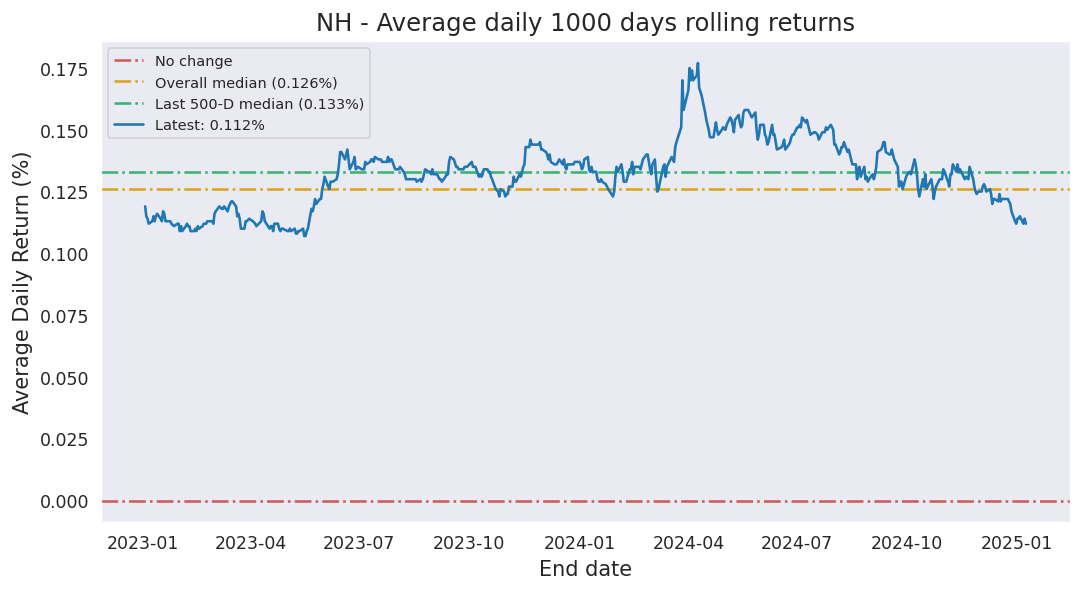
| Average Daily Return | -0.161% | -0.054% | 0.200% | 0.028% | 0.105% |
| Median Close Price | 1869.00 | 1904.50 | 1851.10 | 1805.55 | 1254.45 |
| Lowest Close Price | 1843.10 | 1843.10 | 1718.10 | 1605.30 | 628.05 |
| Highest Close Price | 1878.70 | 1980.60 | 1980.60 | 2043.20 | 2263.20 |
| Mean Value Traded | 528.58M | 564.87M | 618.40M | 820.31M | 558.65M |
Last close price: 1878.7
Average of last 15 days: 1905.21
Average of last 50 days: 1847.93
Average of last 200 days: 1816.14
NH first closed above its last close price on Friday, June 13, 2025 which was 371 days ago.
Since then, it has closed over this price 34.1% of times which is 86 trading days.
Previously, NH closed above its last close price on Friday, June 12, 2026 which was 7 days ago.
Historically, this stock gave a non-positive return for a maximum period of 426 days which was from April 17, 2025 to June 17, 2026.
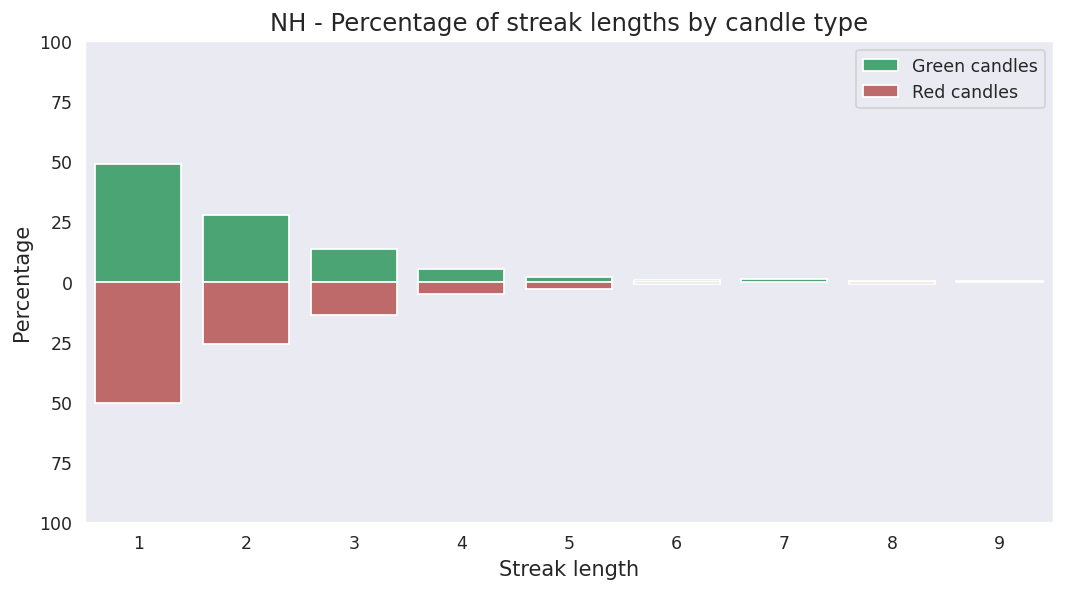
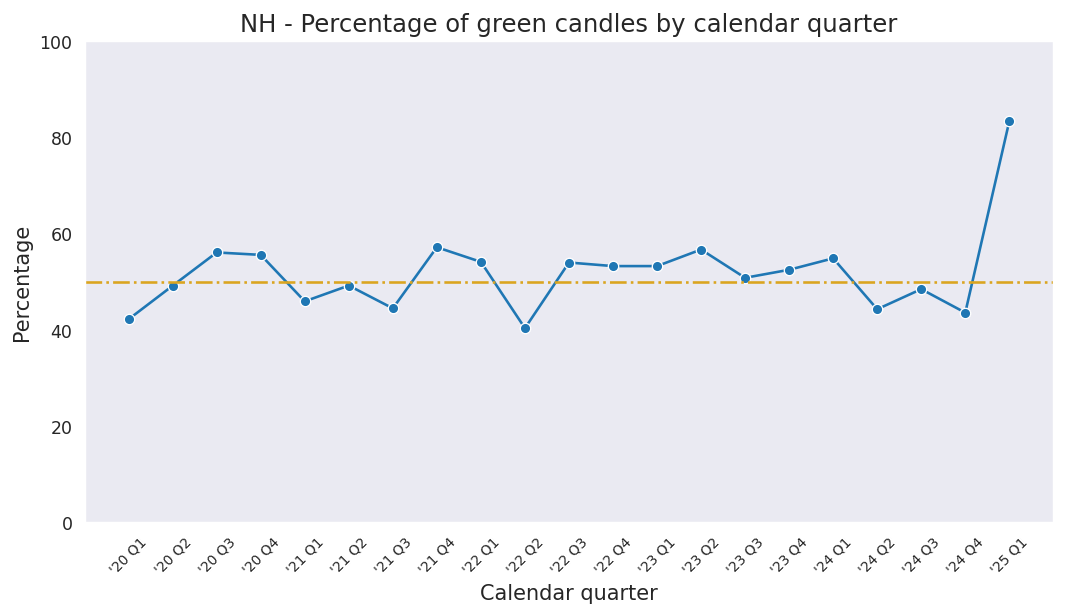
Last candle: Green (0.52%)
Overall percentage of Green candles: 50.0%
Current streak of Green candles: 2
Net change so far for the current streak: 1.93%
Probability of streak continuing: 44.7%
Longest streak of Green candles: 9 trading days from June 25, 2024 to July 05, 2024
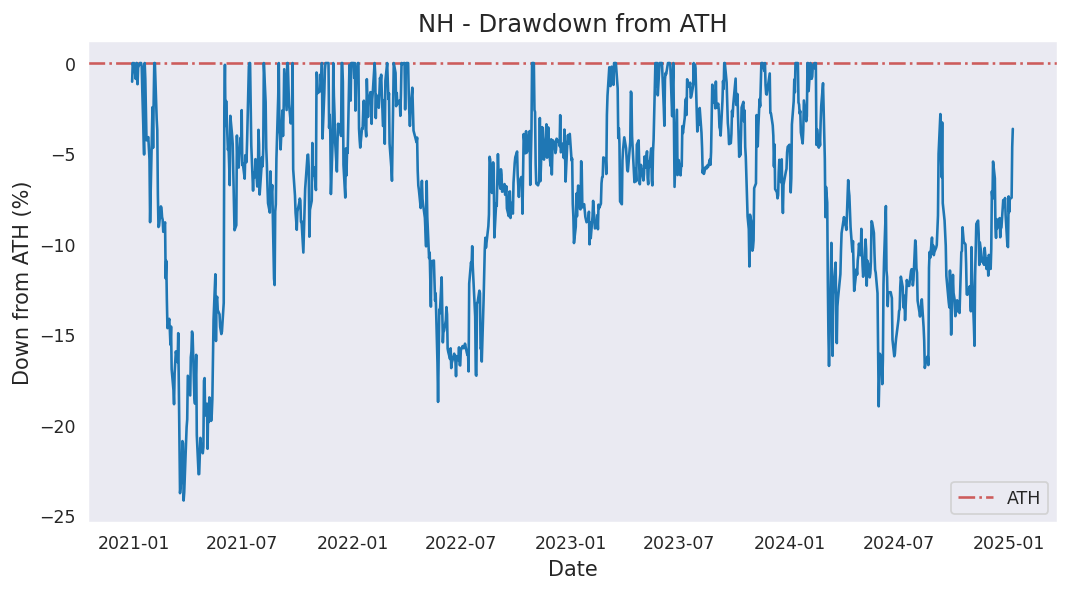
Current down from ATH: -16.99%
Most down from ATH: -40.29%
ATH hits in last 1000 days: 52
ATH was last hit on Friday, June 27, 2025.