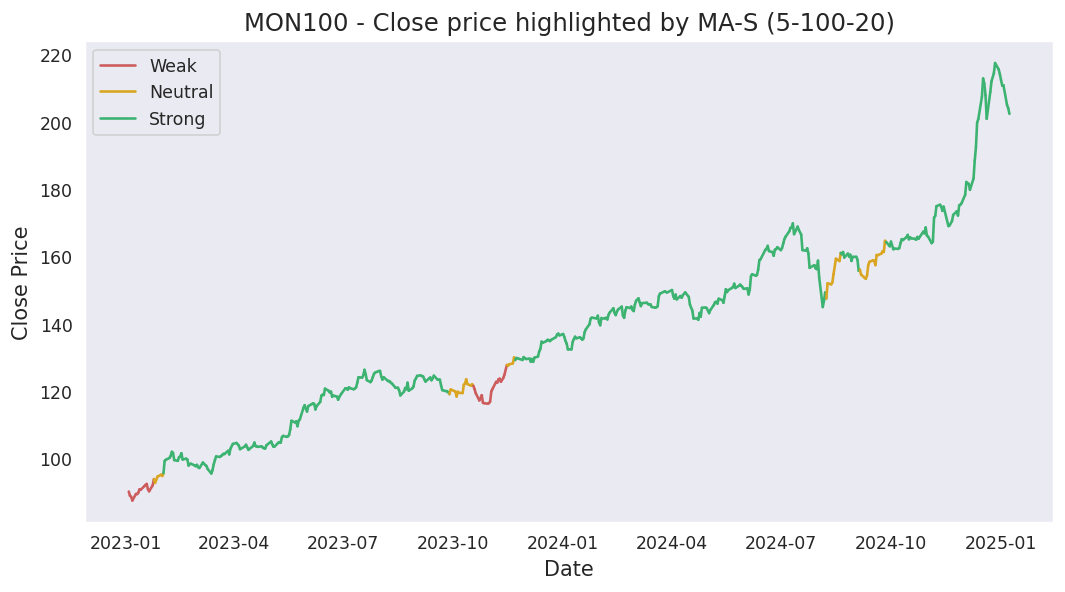
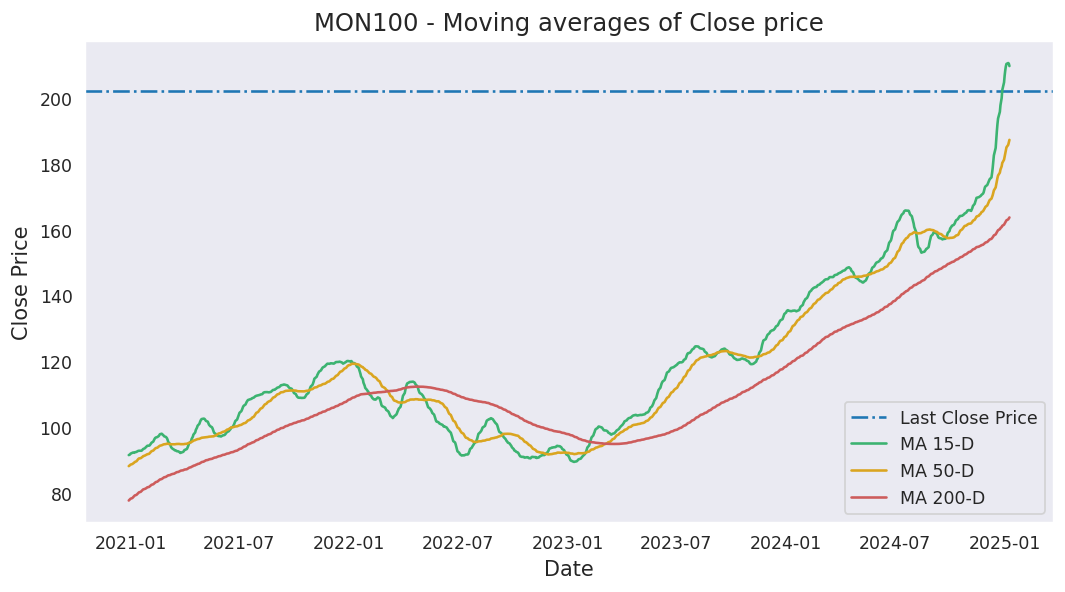
Moving averages
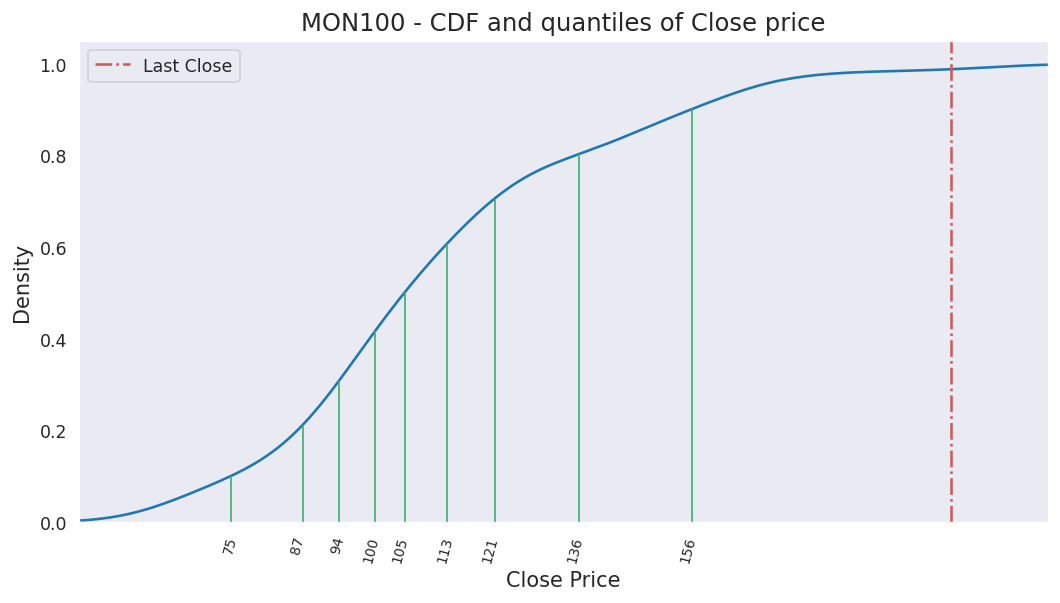
Last close price: 328.41
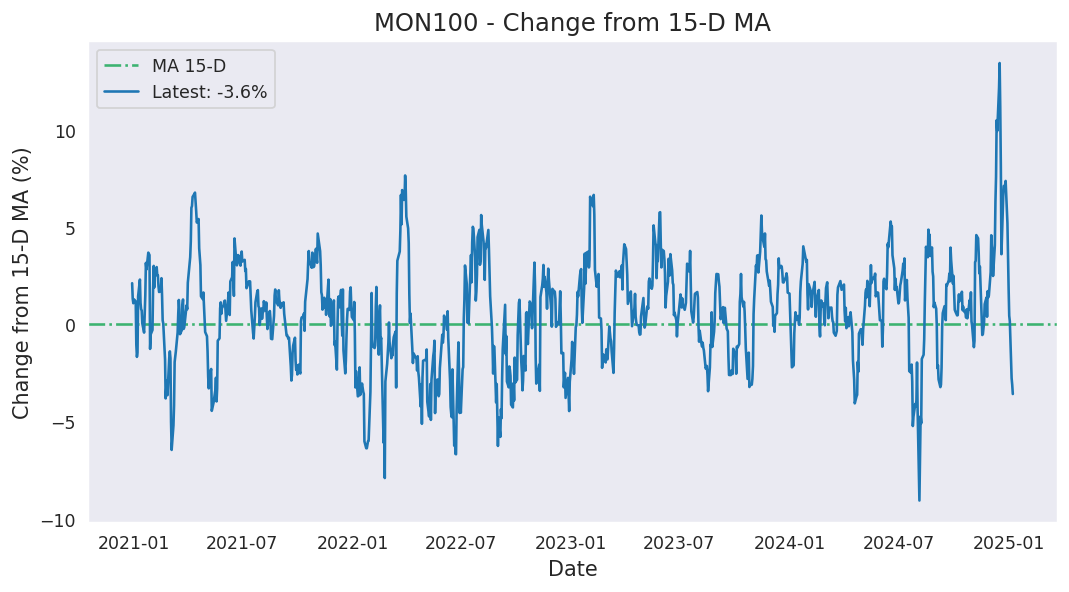
Average of last 15 days: 331.19
Average of last 50 days: 312.03
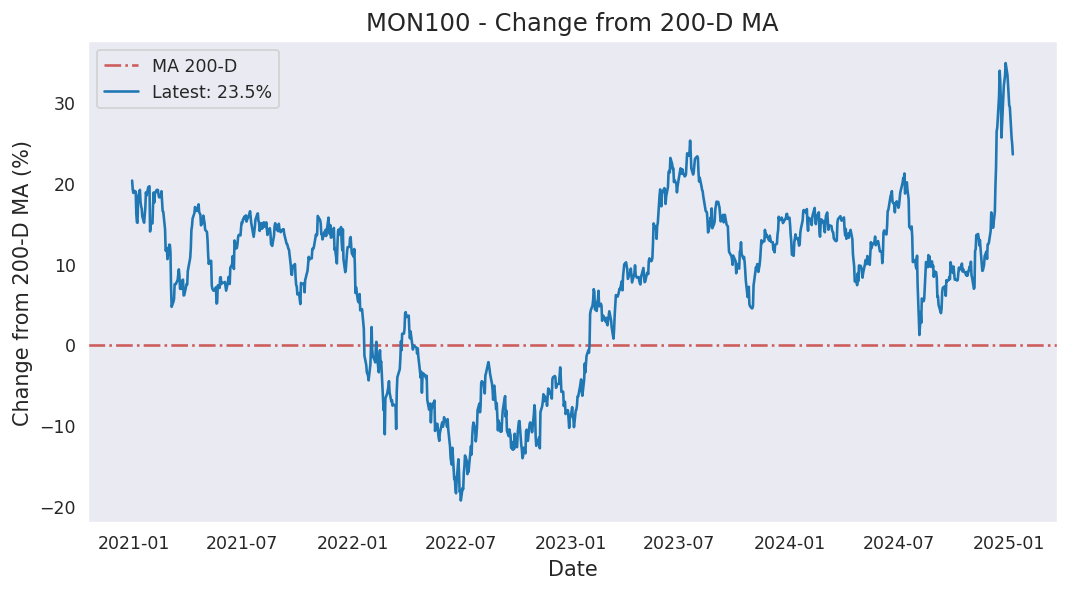
Average of last 200 days: 250.04
Analysis based on 1606 records from January 01, 2020 to June 19, 2026
Last updated on June 19, 2026
| 5 Days | 15 Days | 50 Days | 200 Days | 1000 Days | |
|---|---|---|---|---|---|
| Start Date | June 15, 2026 | June 01, 2026 | April 08, 2026 | August 28, 2025 | June 08, 2022 |
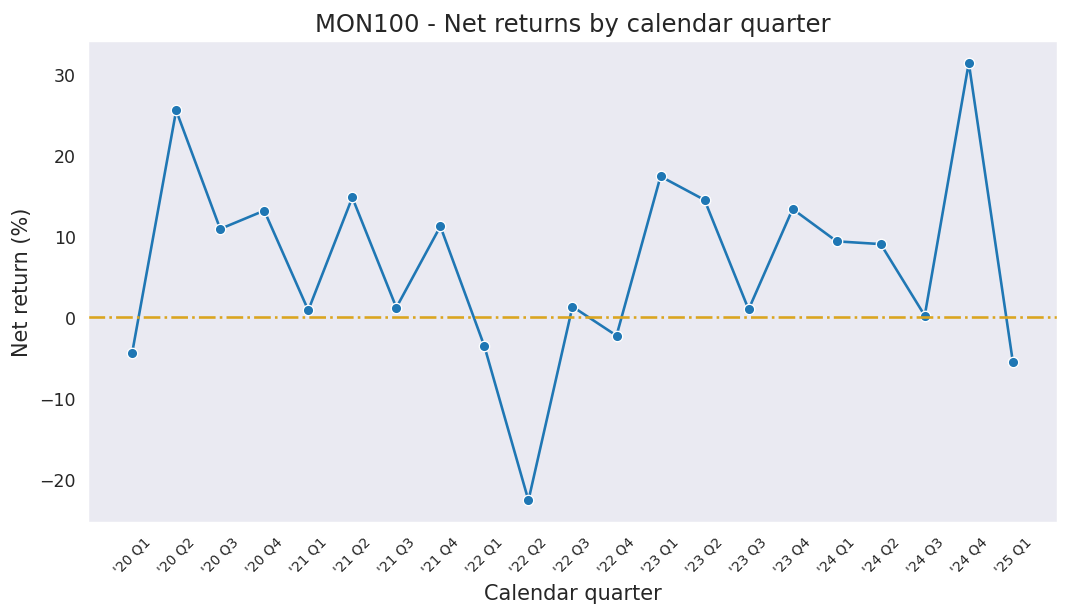
| Net Return | 3.26% | -2.29% | 33.85% | 62.19% | 226.74% |
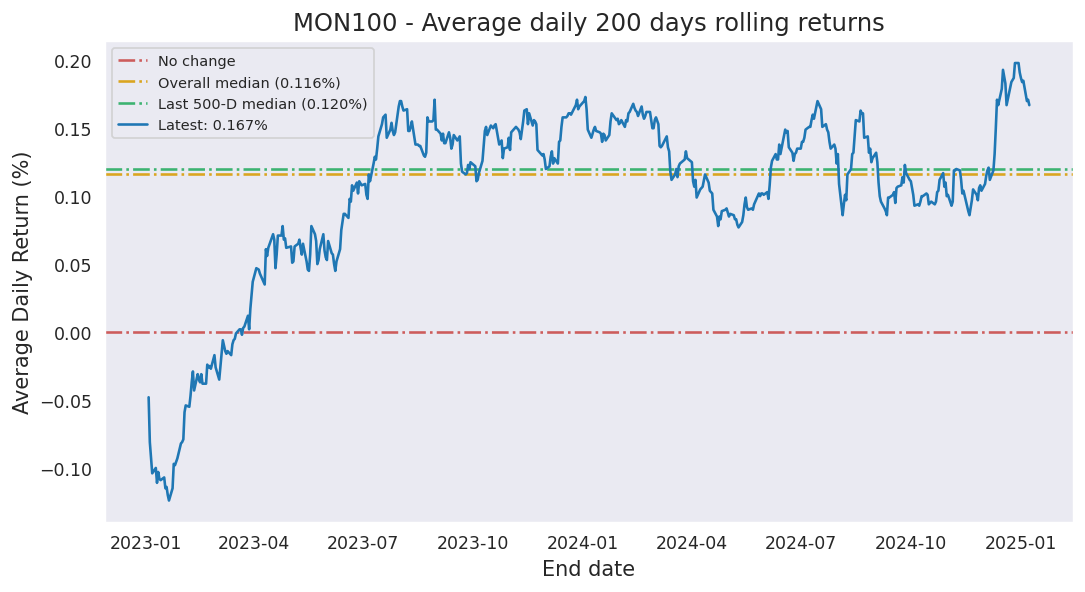
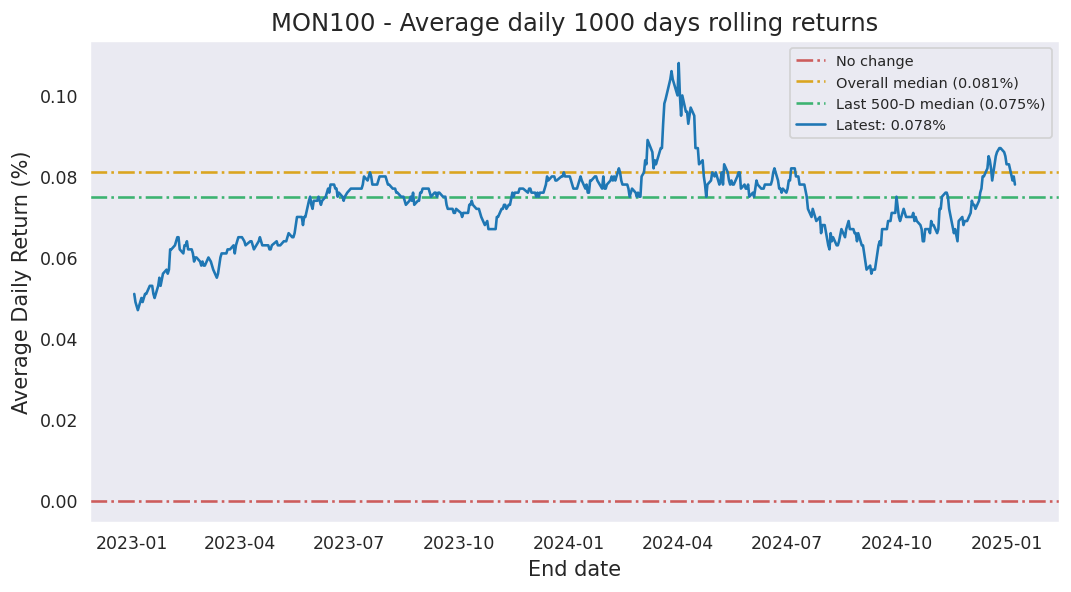
| Average Daily Return | 0.644% | -0.154% | 0.585% | 0.242% | 0.118% |
| Median Close Price | 330.19 | 330.89 | 322.68 | 234.62 | 152.04 |
| Lowest Close Price | 328.41 | 318.03 | 254.33 | 202.37 | 87.52 |
| Highest Close Price | 333.31 | 342.55 | 342.55 | 342.55 | 342.55 |
| Mean Value Traded | 253.03M | 314.28M | 282.79M | 252.11M | 133.02M |
Last close price: 328.41
Average of last 15 days: 331.19
Average of last 50 days: 312.03
Average of last 200 days: 250.04
MON100 first closed above its last close price on Friday, May 15, 2026 which was 35 days ago.
Since then, it has closed over this price 72.0% of times which is 18 trading days.
Previously, MON100 closed above its last close price on Thursday, June 18, 2026 which was 1 days ago.
Historically, this stock gave a non-positive return for a maximum period of 856 days which was from September 02, 2020 to January 06, 2023.
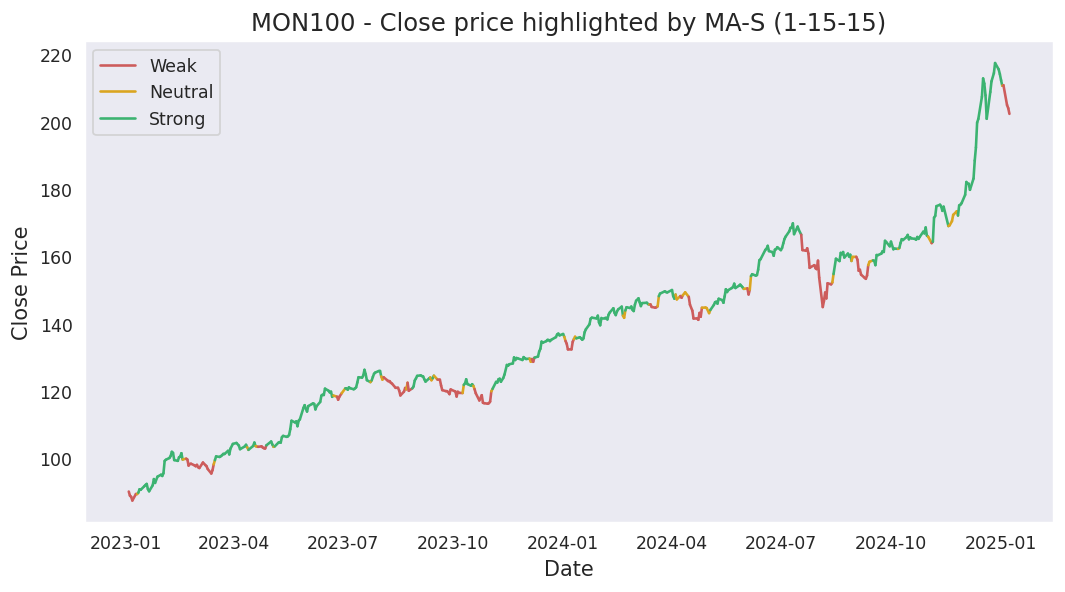
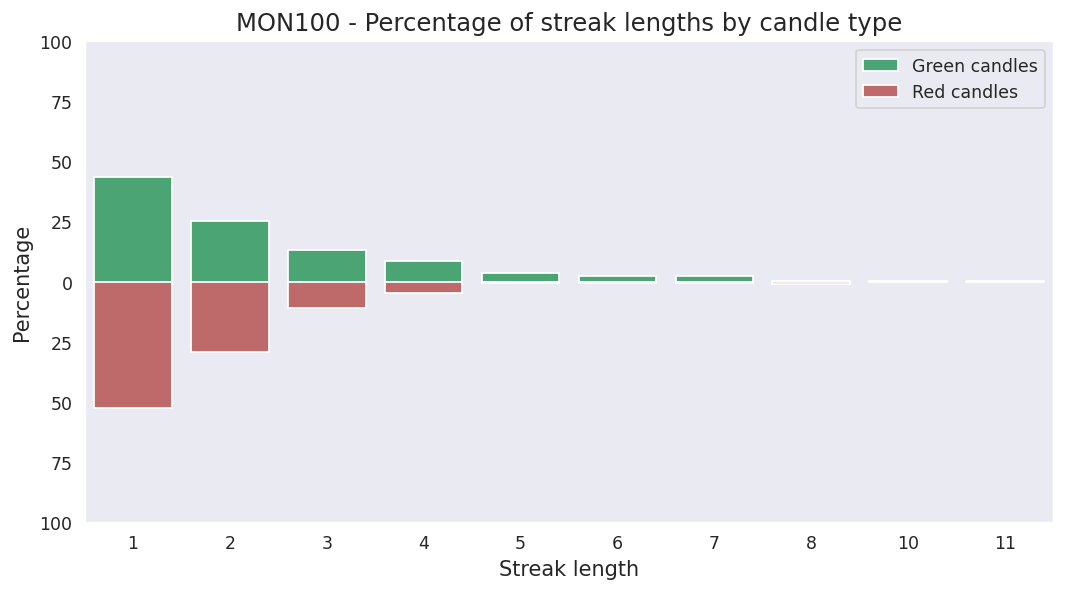
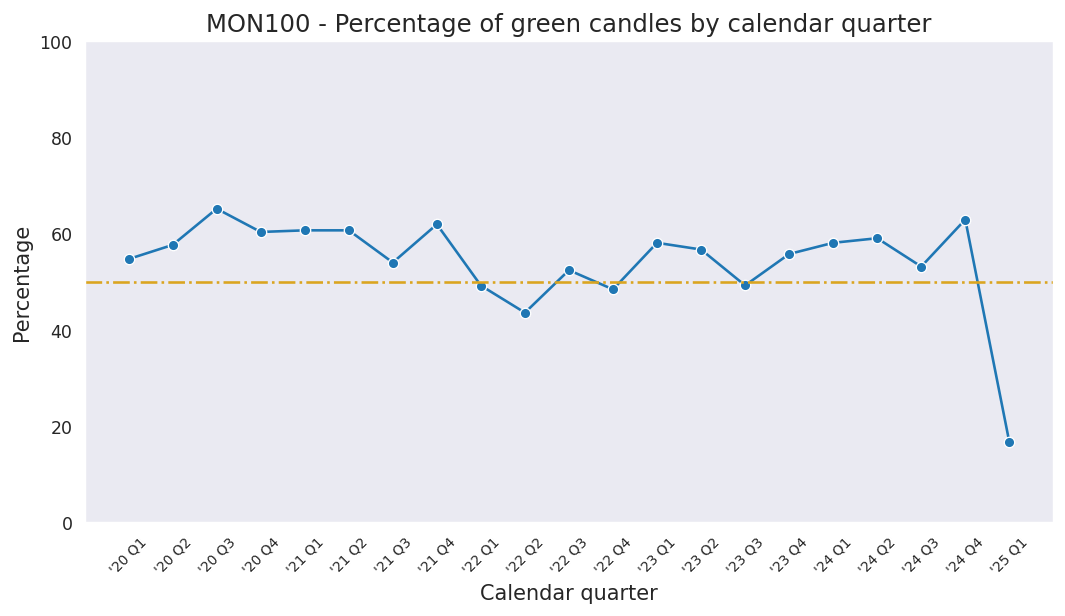
Last candle: Red (-1.01%)
Overall percentage of Red candles: 45.1%
Current streak of Red candles: 2
Net change so far for the current streak: -1.47%
Probability of streak continuing: 39.8%
Longest streak of Red candles: 8 trading days from September 18, 2023 to September 28, 2023
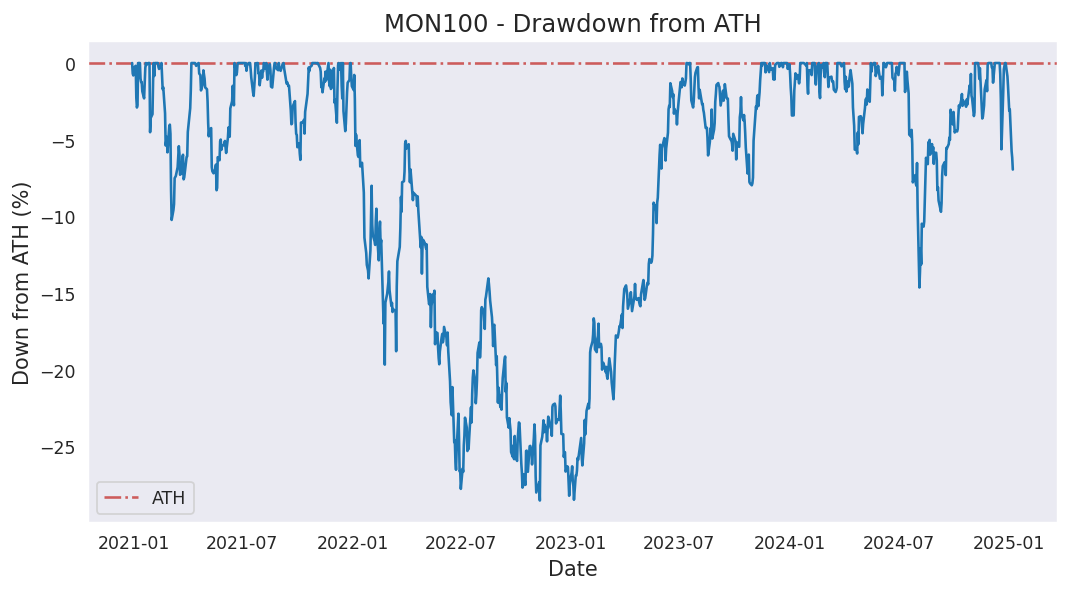
Current down from ATH: -4.13%
Most down from ATH: -28.51%
ATH hits in last 1000 days: 103
ATH was last hit on Friday, June 05, 2026.