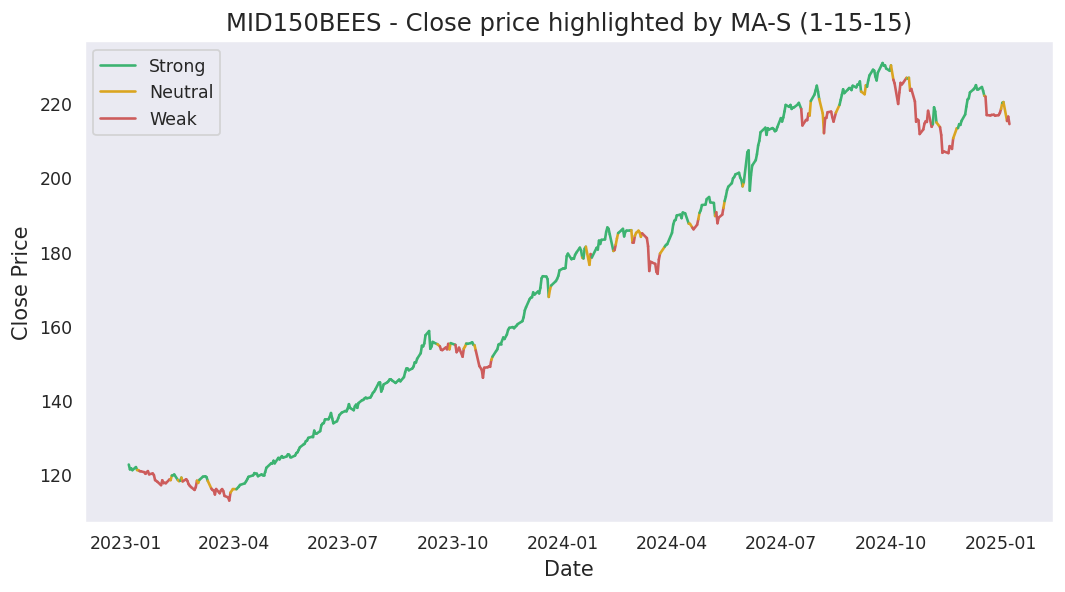
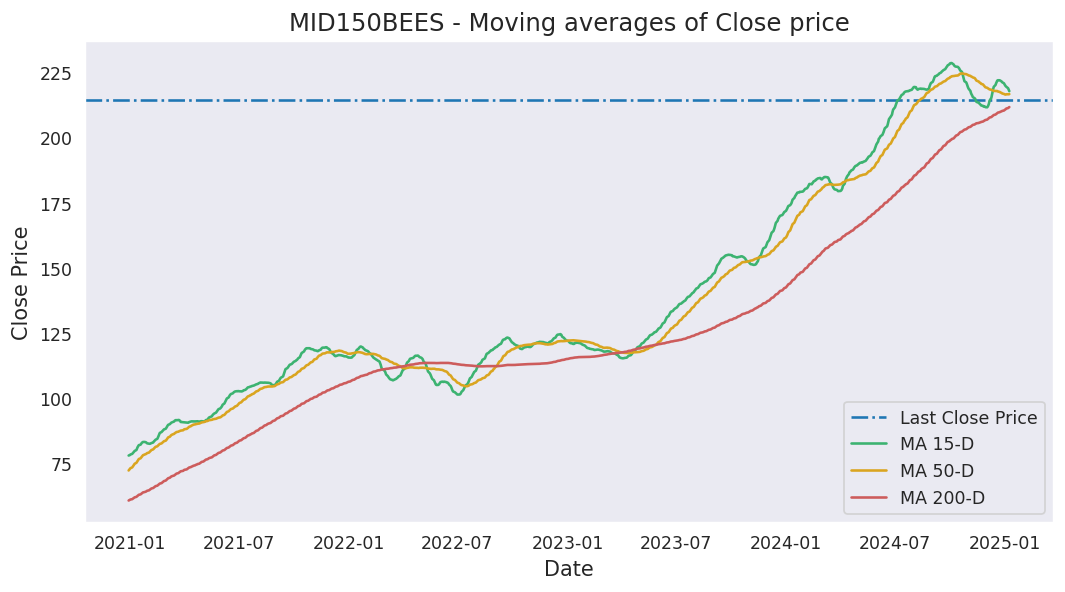
Moving averages
Last close price: 237.0
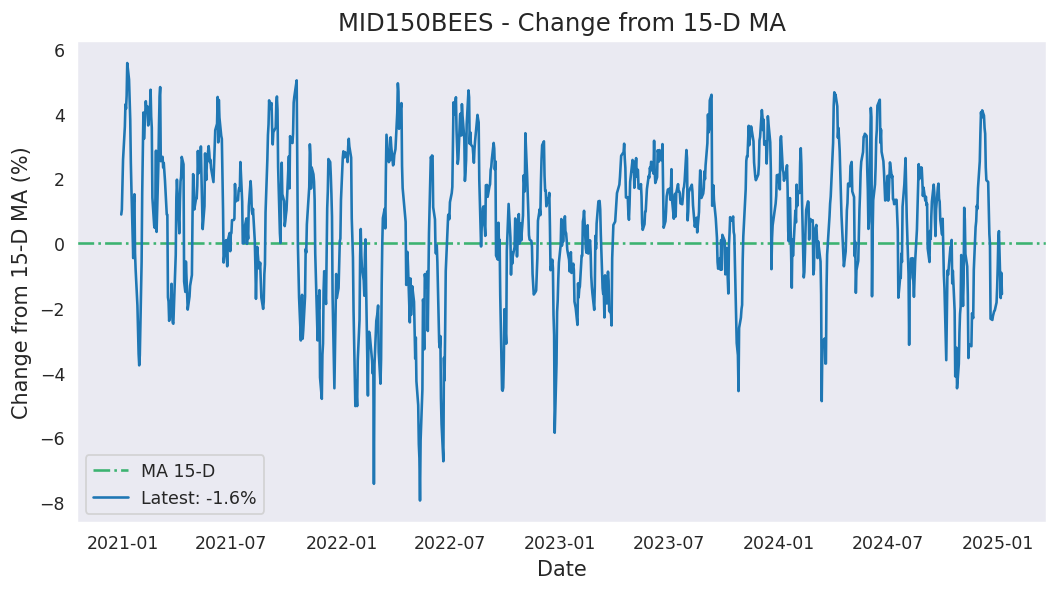
Average of last 15 days: 230.99
Average of last 50 days: 229.43
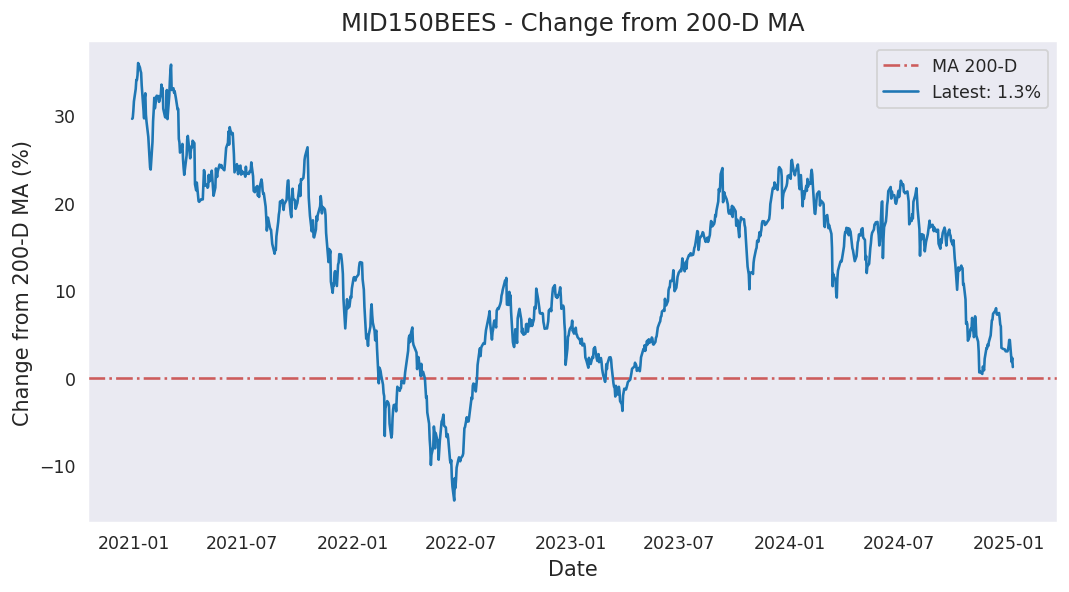
Average of last 200 days: 224.88
Analysis based on 1606 records from January 01, 2020 to June 19, 2026
Last updated on June 19, 2026
| 5 Days | 15 Days | 50 Days | 200 Days | 1000 Days | |
|---|---|---|---|---|---|
| Start Date | June 15, 2026 | June 01, 2026 | April 08, 2026 | August 28, 2025 | June 08, 2022 |
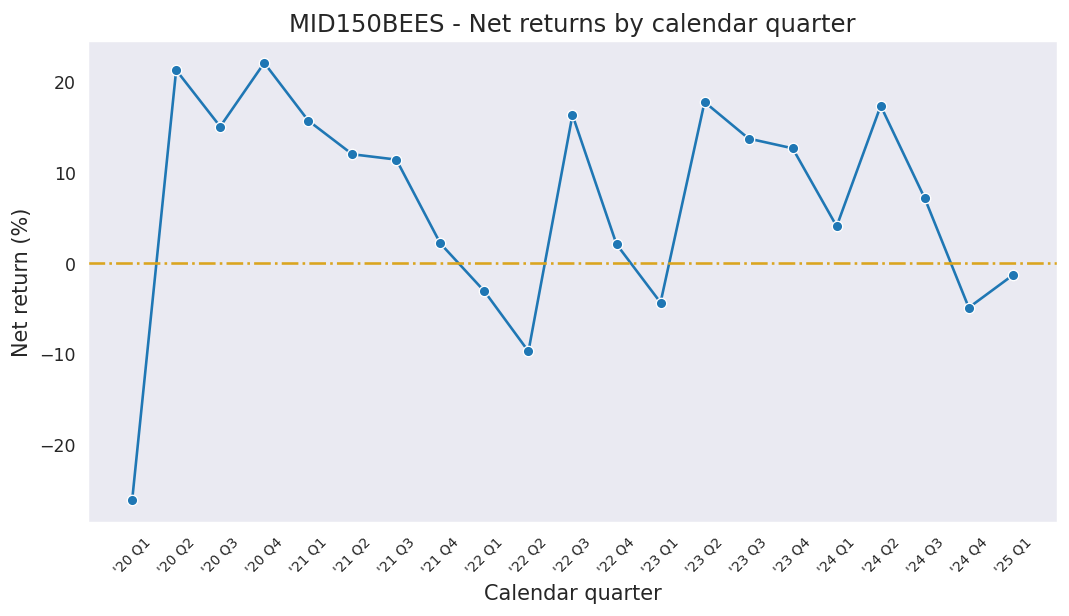
| Net Return | 2.92% | 1.67% | 13.96% | 8.75% | 123.73% |
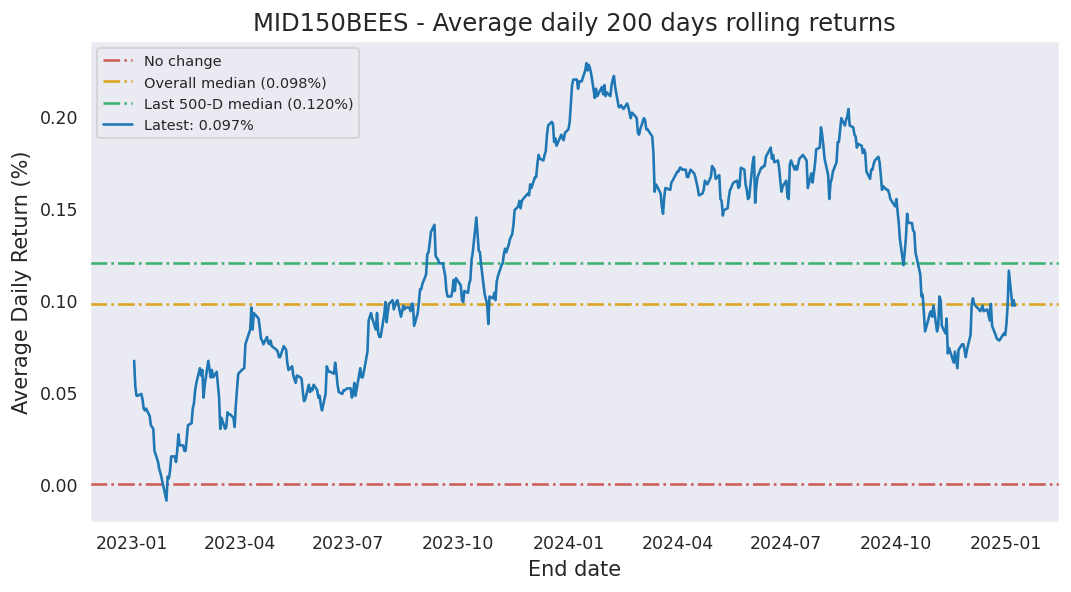
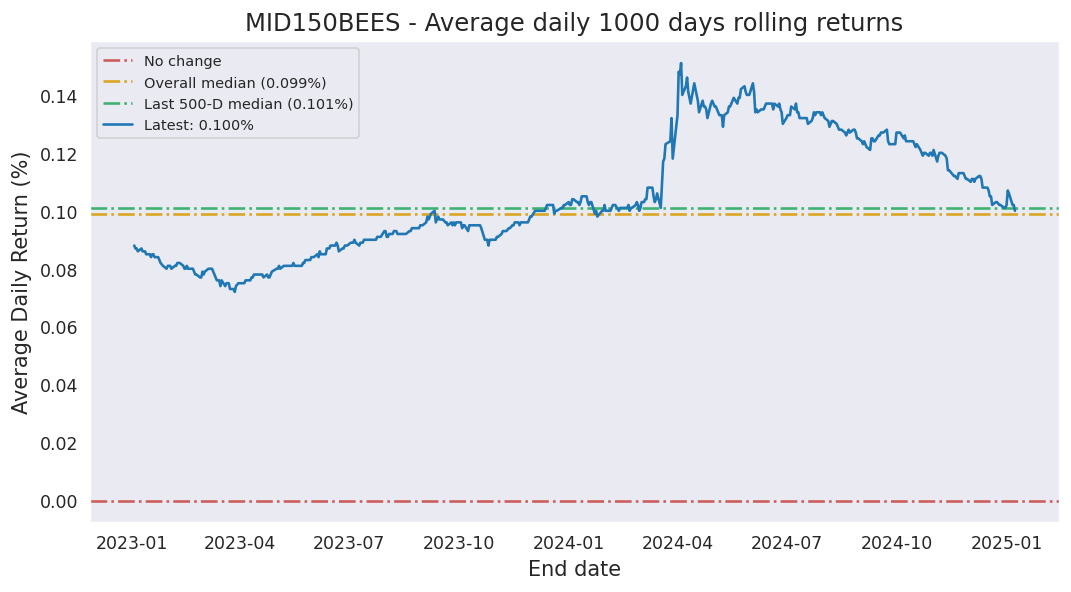
| Average Daily Return | 0.577% | 0.111% | 0.262% | 0.042% | 0.081% |
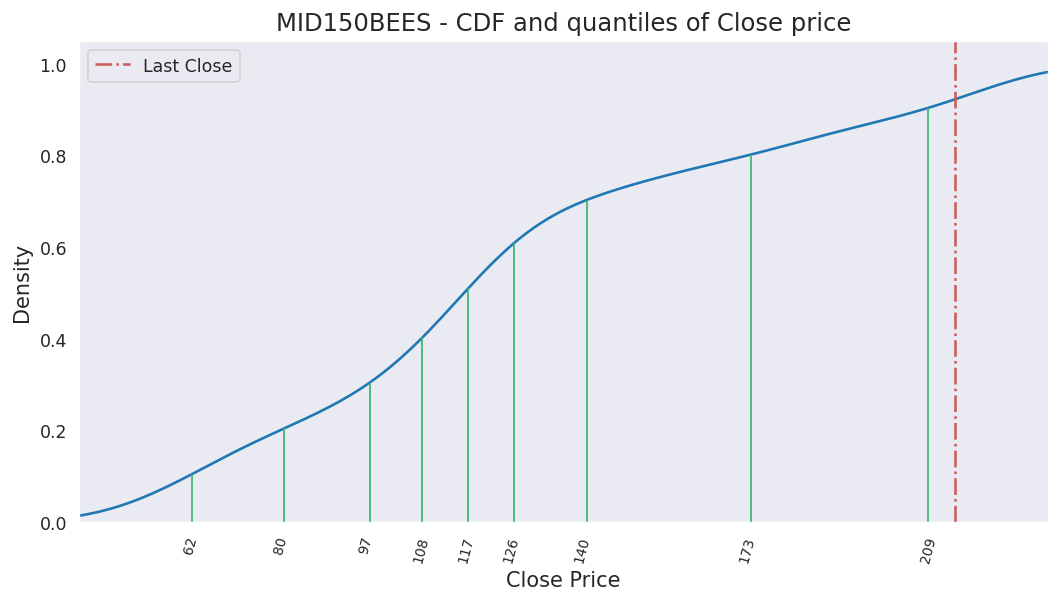
| Median Close Price | 235.37 | 230.28 | 229.60 | 226.41 | 192.95 |
| Lowest Close Price | 233.69 | 224.73 | 216.31 | 200.30 | 97.57 |
| Highest Close Price | 237.00 | 237.00 | 237.00 | 237.00 | 237.00 |
| Mean Value Traded | 191.35M | 204.35M | 222.16M | 222.91M | 116.31M |
Last close price: 237.0
Average of last 15 days: 230.99
Average of last 50 days: 229.43
Average of last 200 days: 224.88
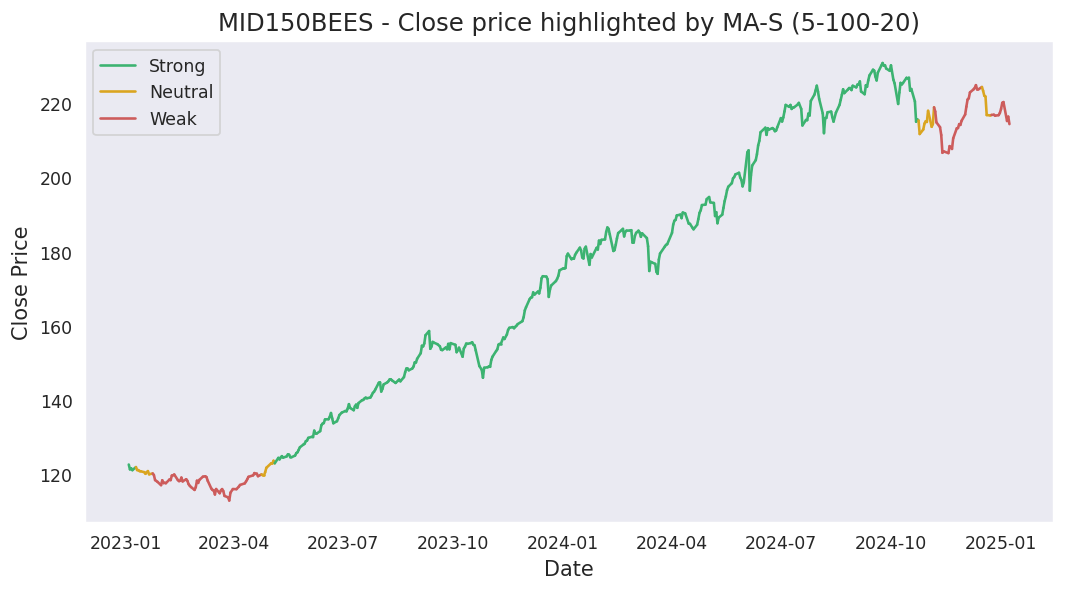
This is the first time MID150BEES has closed at this high a price.
Since then, it has closed over this price 100.0% of times which is 1 trading days.
Historically, this stock gave a non-positive return for a maximum period of 680 days which was from July 31, 2024 to June 11, 2026.
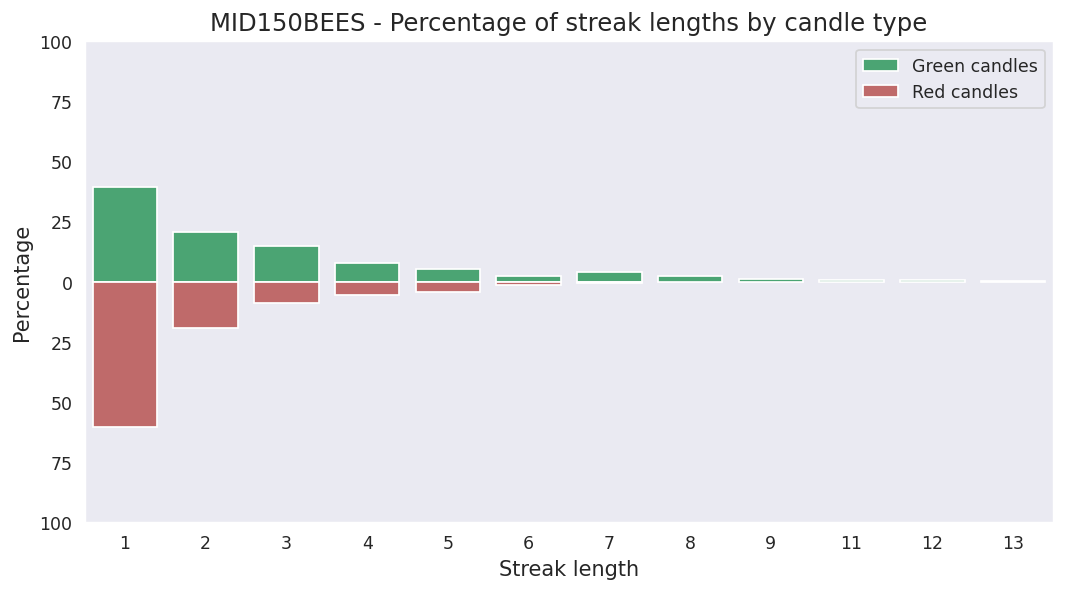
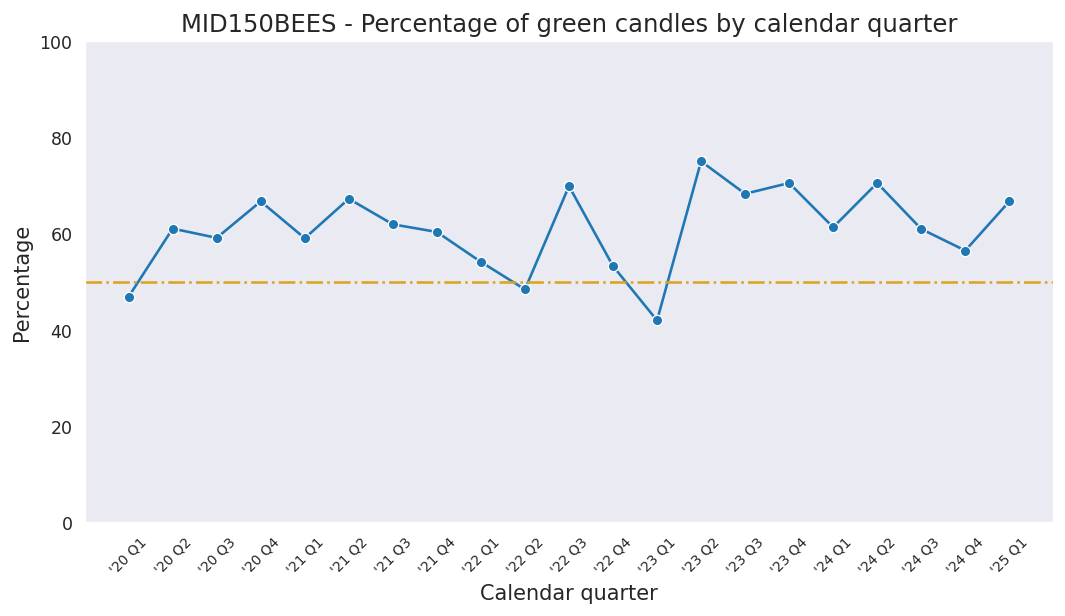
Last candle: Green (0.26%)
Overall percentage of Green candles: 59.4%
Current streak of Green candles: 6
Net change so far for the current streak: 5.46%
Probability of streak continuing: 75.6%
Longest streak of Green candles: 13 trading days from May 21, 2021 to June 08, 2021
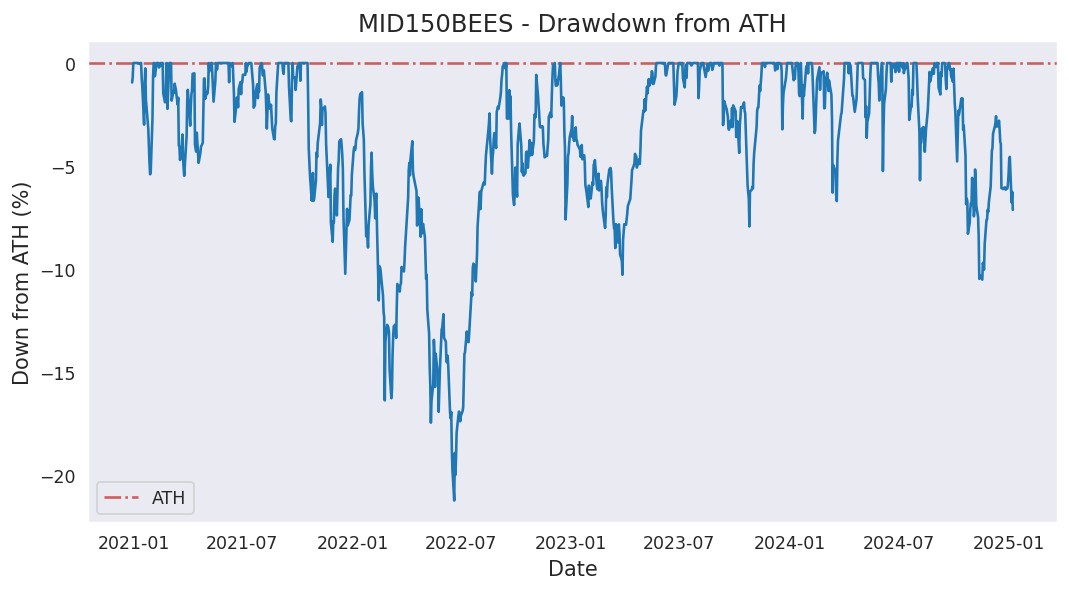
Current down from ATH: 0.00%
Most down from ATH: -38.43%
ATH hits in last 1000 days: 140
ATH was last hit on Friday, June 19, 2026.