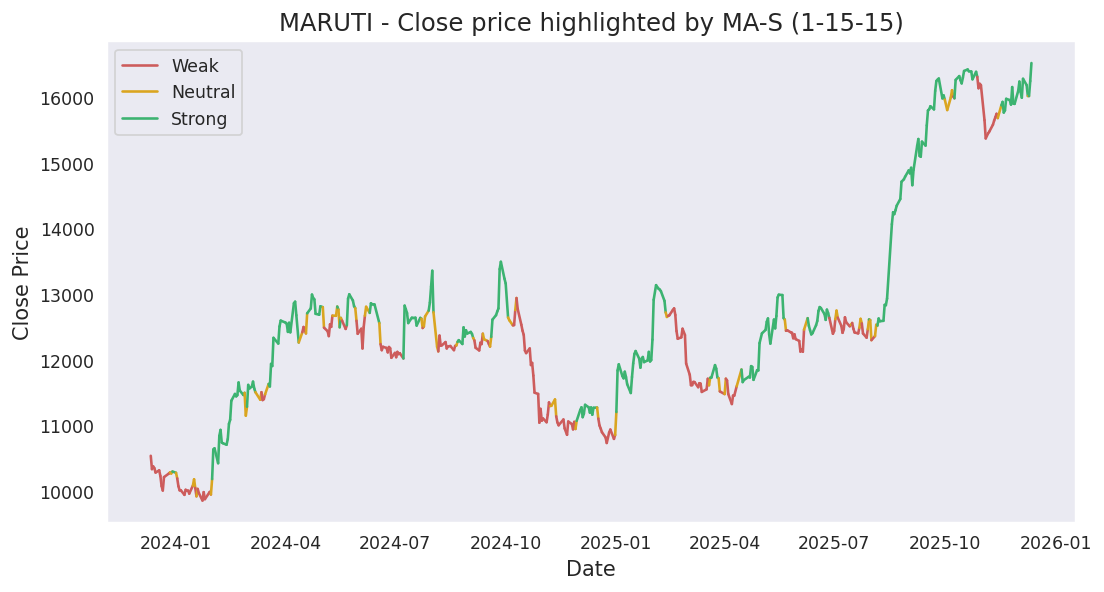
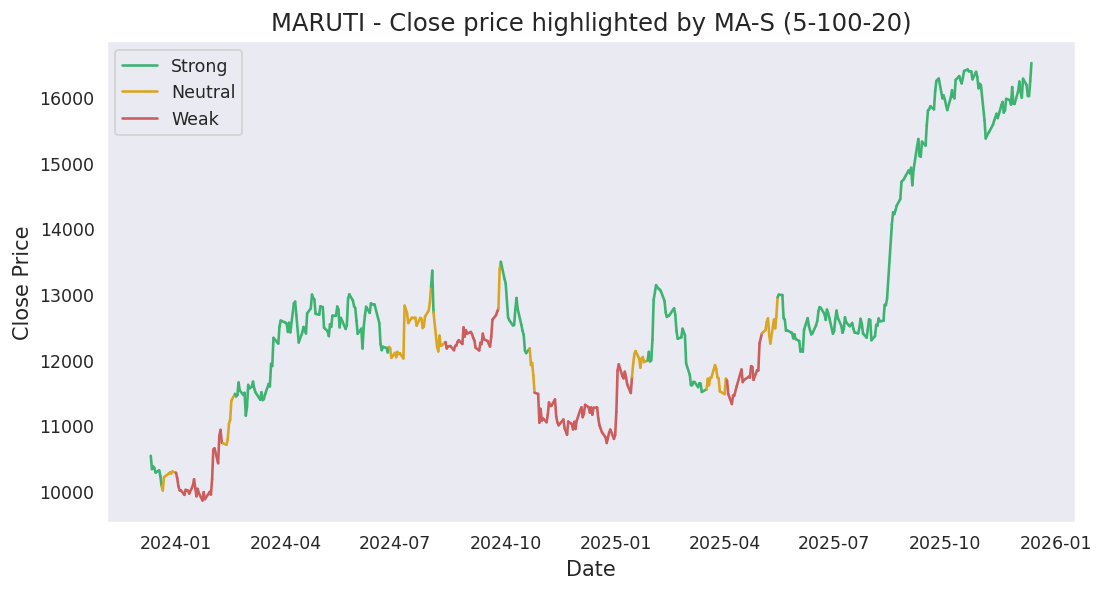
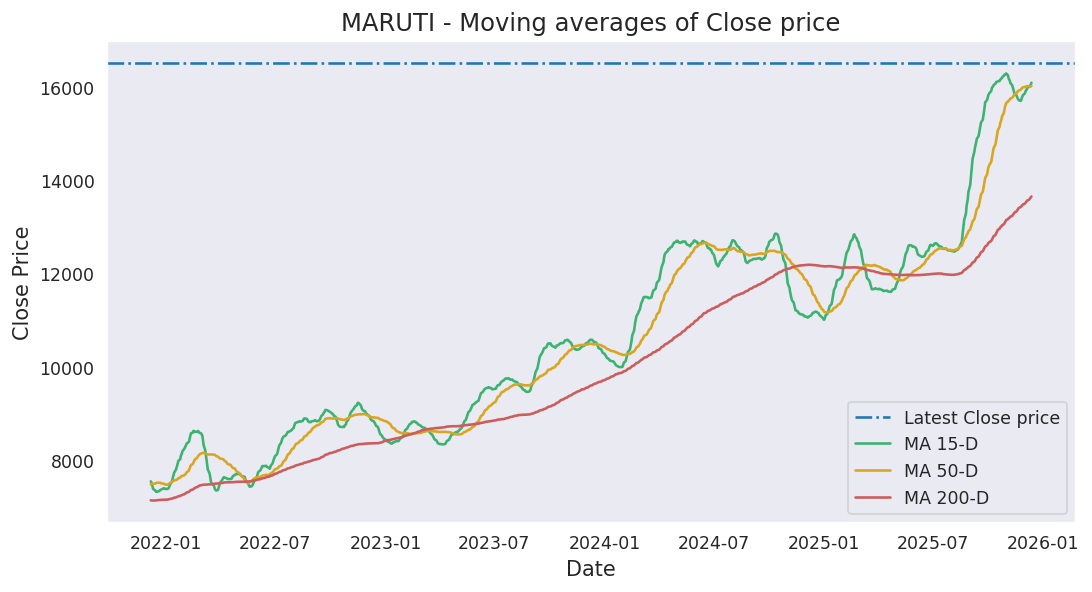
Moving averages
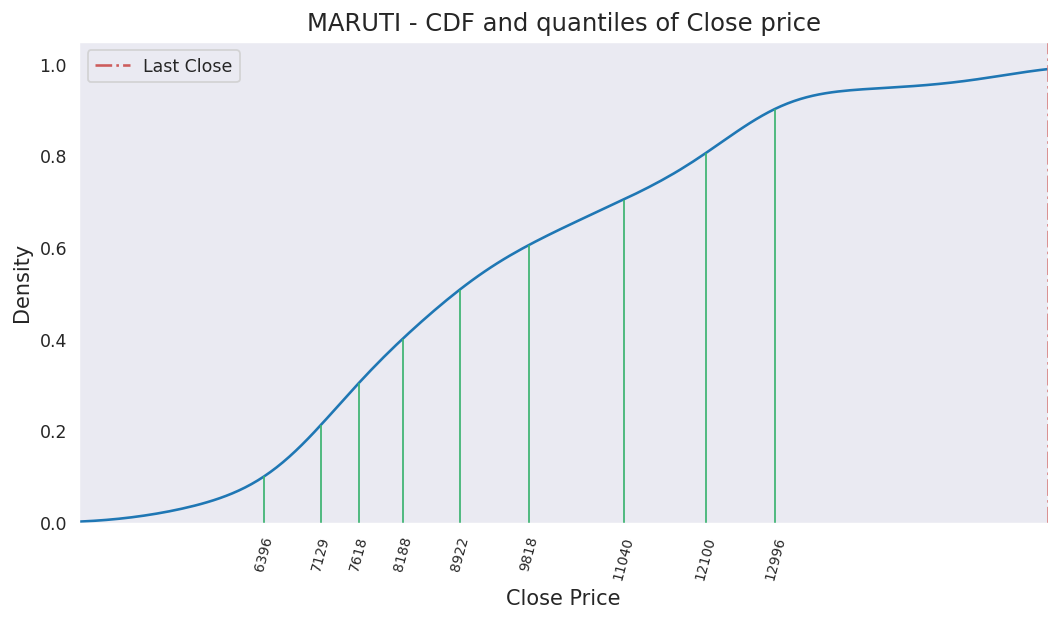
Last close price: 13395.0
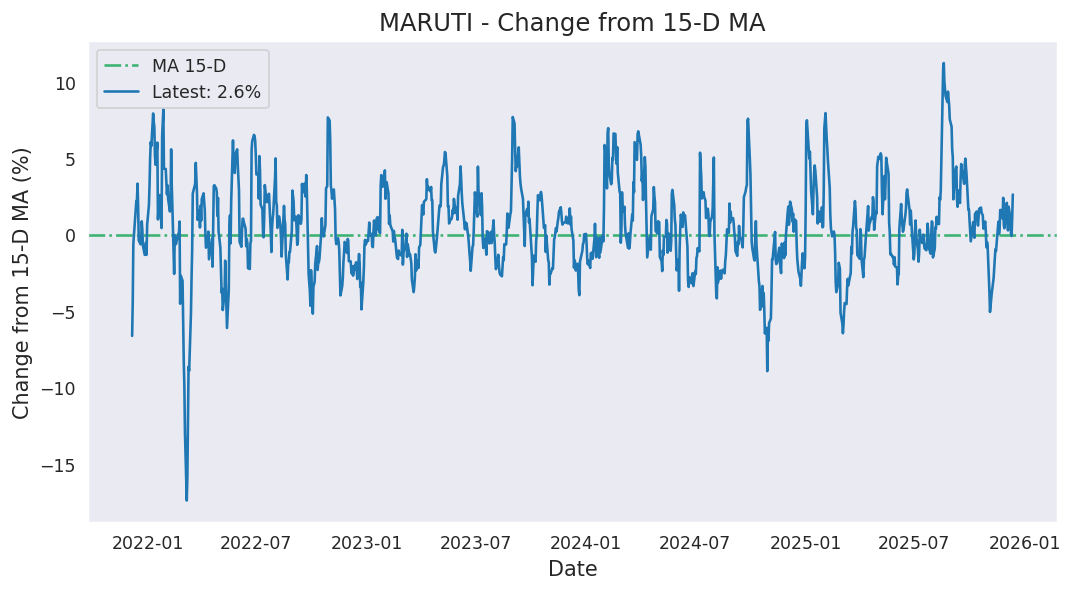
Average of last 15 days: 13246.67
Average of last 50 days: 13280.26
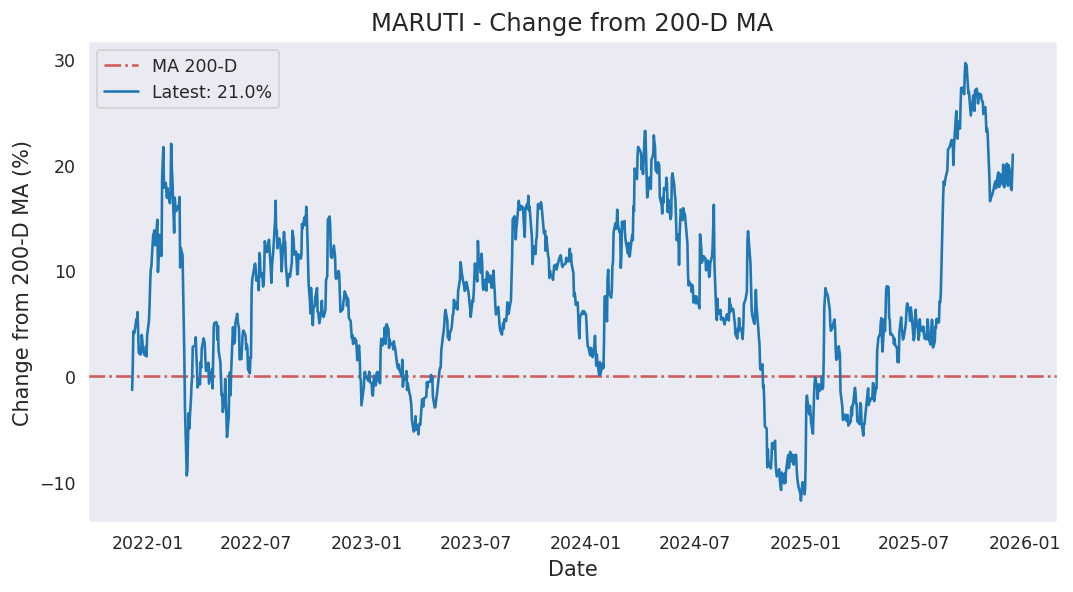
Average of last 200 days: 14858.14
Analysis based on 1606 records from January 01, 2020 to June 19, 2026
Last updated on June 19, 2026
| 5 Days | 15 Days | 50 Days | 200 Days | 1000 Days | |
|---|---|---|---|---|---|
| Start Date | June 15, 2026 | June 01, 2026 | April 08, 2026 | August 28, 2025 | June 08, 2022 |
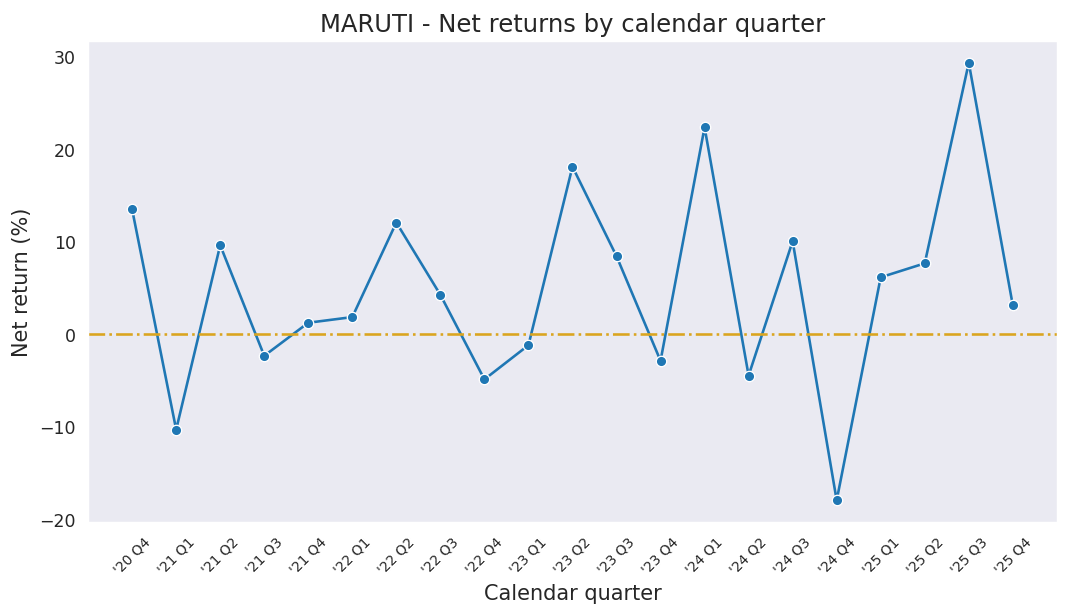
| Net Return | 0.22% | 2.04% | 4.66% | -8.96% | 71.52% |
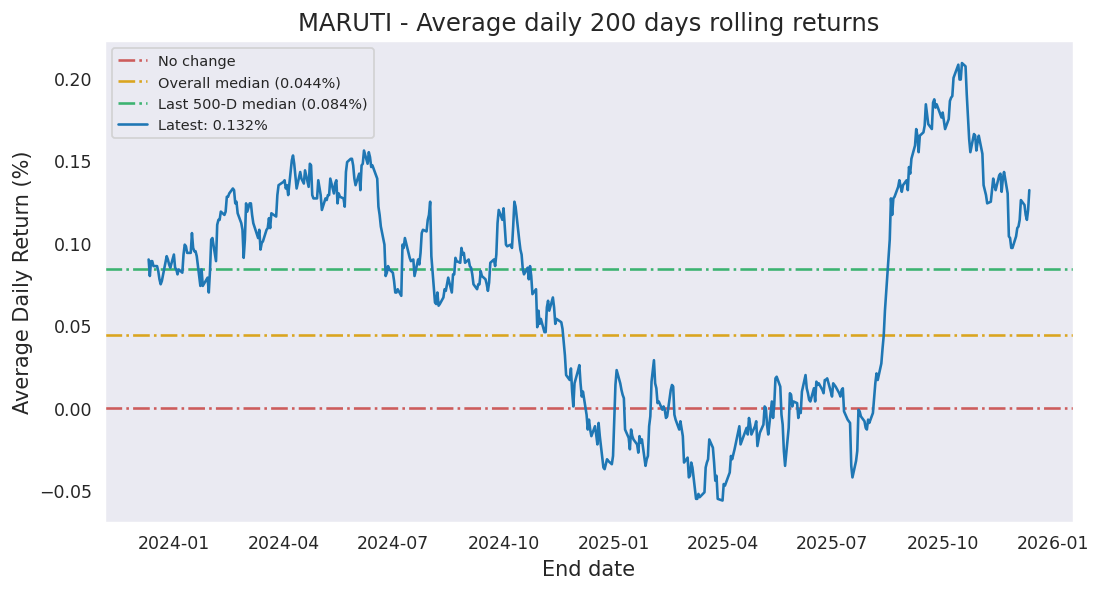
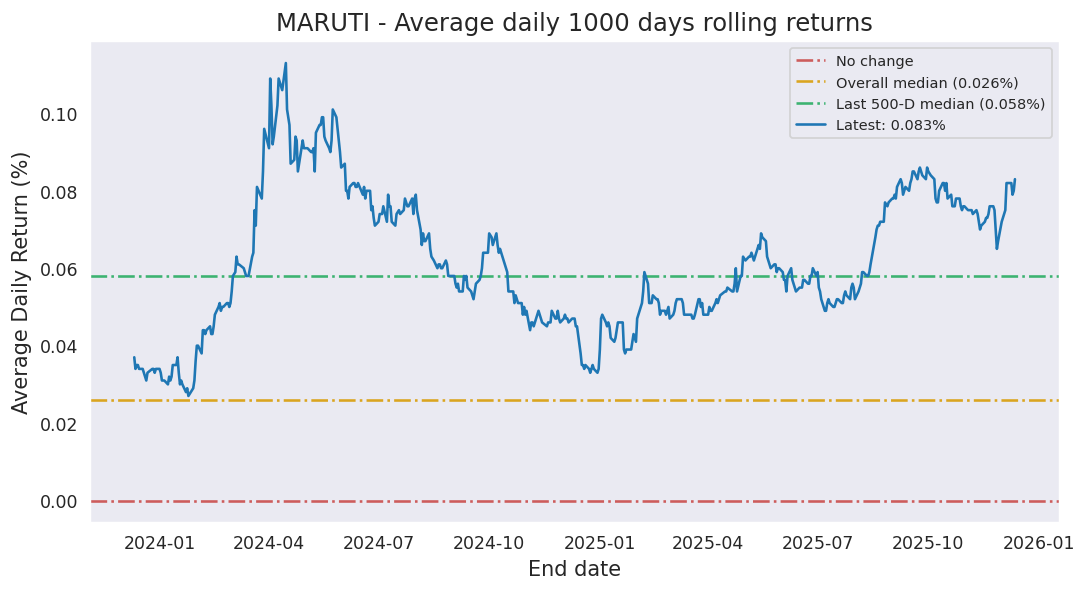
| Average Daily Return | 0.043% | 0.135% | 0.091% | -0.047% | 0.054% |
| Median Close Price | 13630.00 | 13098.00 | 13221.50 | 15155.00 | 11619.15 |
| Lowest Close Price | 13395.00 | 12912.00 | 12892.00 | 12306.00 | 7660.95 |
| Highest Close Price | 13805.00 | 13805.00 | 13805.00 | 17292.00 | 17292.00 |
| Mean Value Traded | 6.07B | 5.62B | 6.37B | 6.47B | 5.64B |
Last close price: 13395.0
Average of last 15 days: 13246.67
Average of last 50 days: 13280.26
Average of last 200 days: 14858.14
MARUTI first closed above its last close price on Friday, September 27, 2024 which was 630 days ago.
Since then, it has closed over this price 37.2% of times which is 159 trading days.
Previously, MARUTI closed above its last close price on Thursday, June 18, 2026 which was 1 days ago.
Historically, this stock gave a non-positive return for a maximum period of 866 days which was from January 01, 2020 to May 16, 2022.
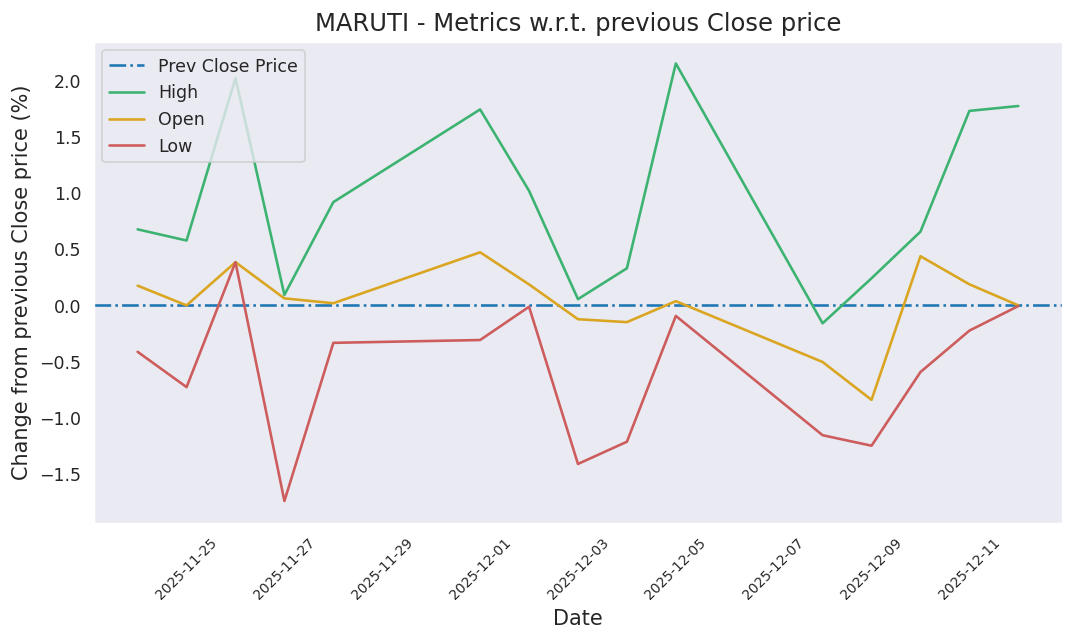
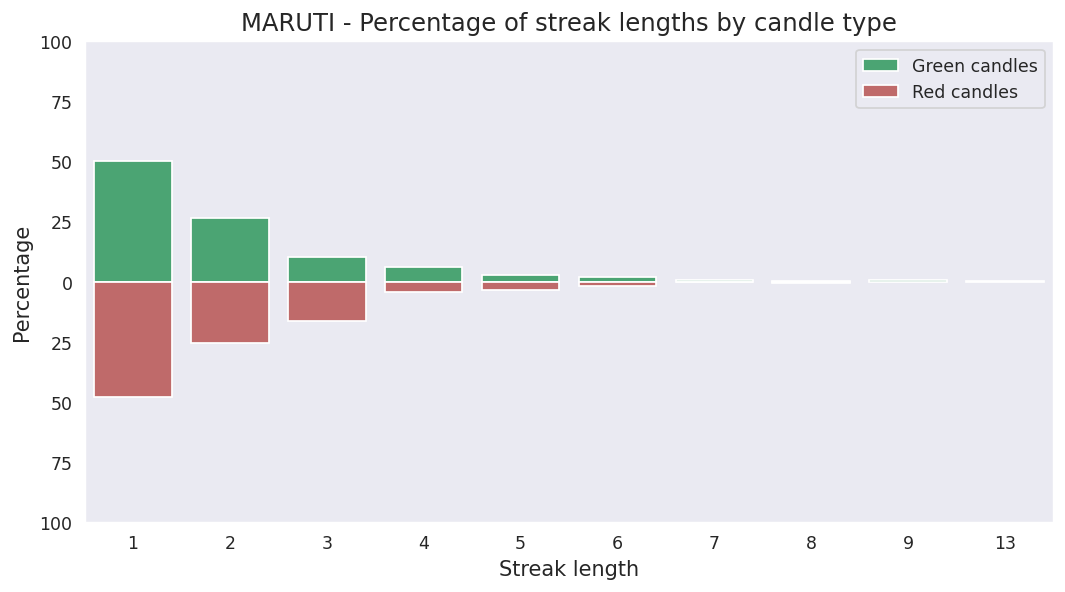
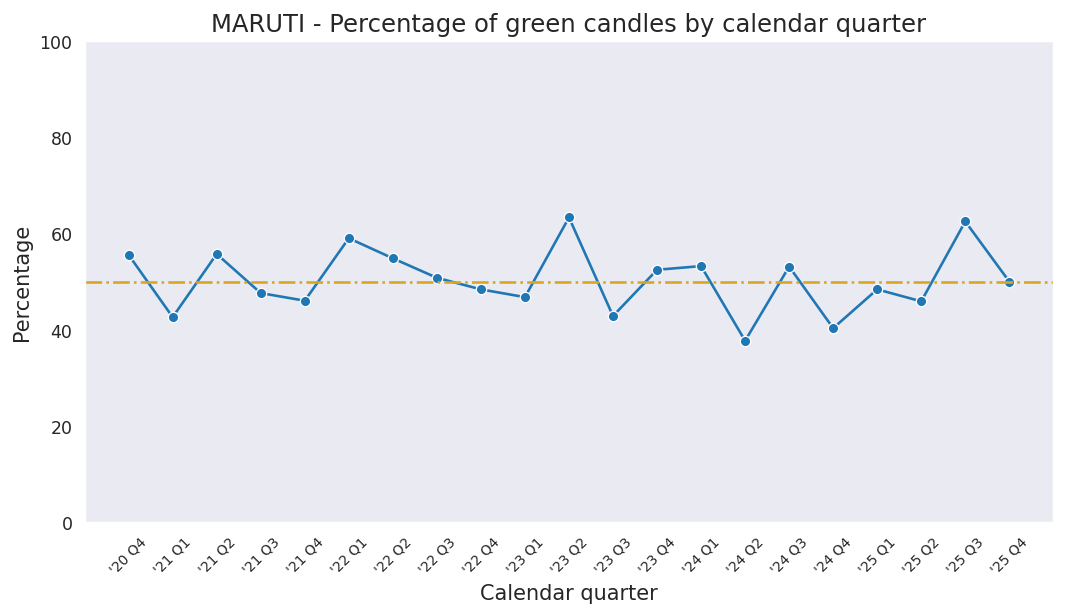
Last candle: Red (-0.66%)
Overall percentage of Red candles: 49.8%
Current streak of Red candles: 4
Net change so far for the current streak: -2.97%
Probability of streak continuing: 58.5%
Longest streak of Red candles: 8 trading days from November 18, 2021 to November 30, 2021
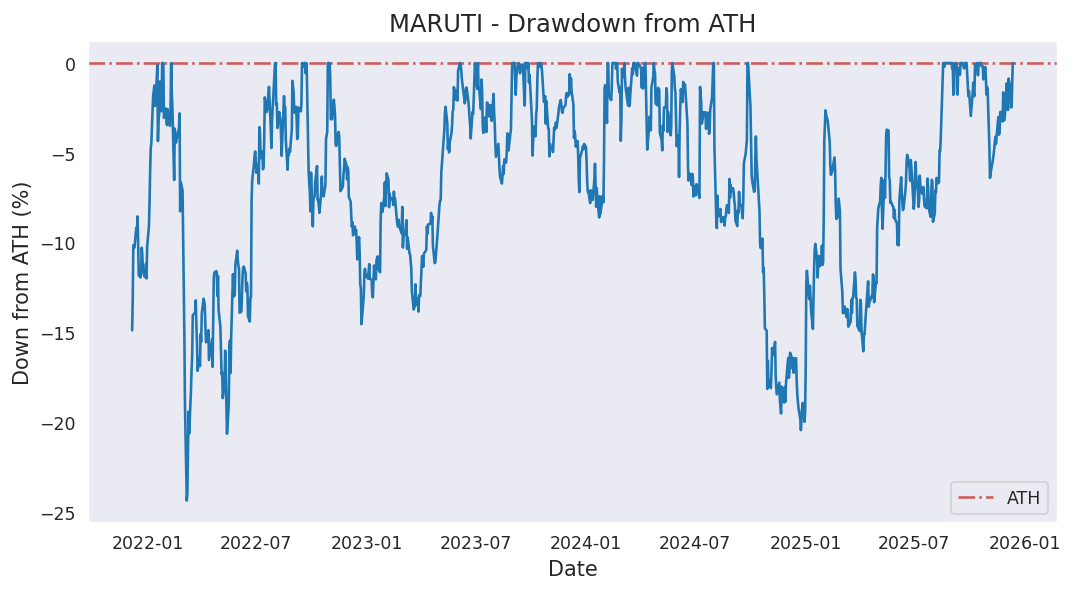
Current down from ATH: -22.54%
Most down from ATH: -46.66%
ATH hits in last 1000 days: 72
ATH was last hit on Tuesday, January 06, 2026.