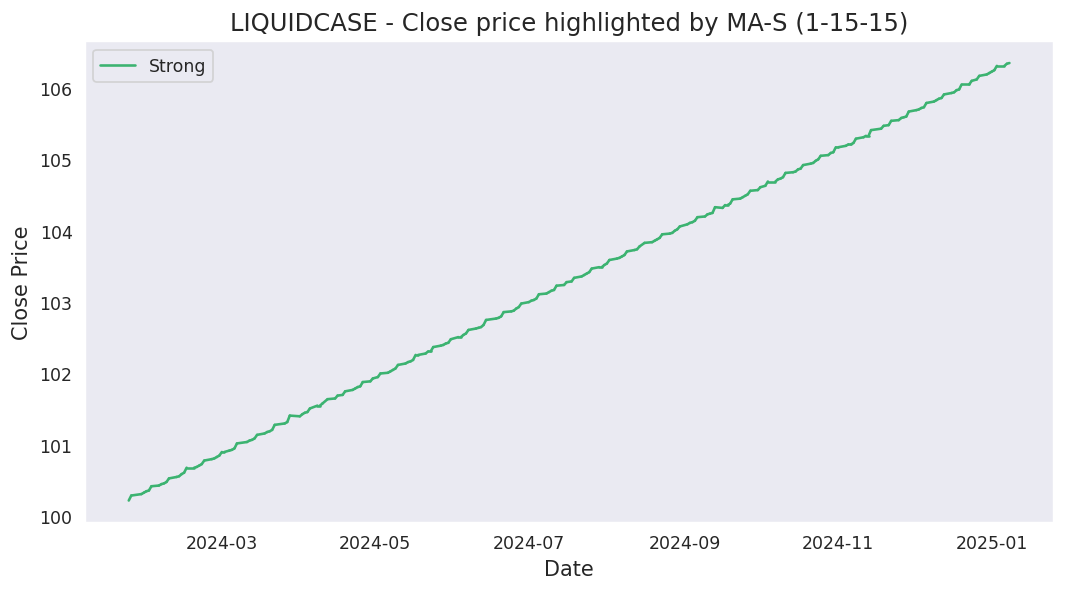
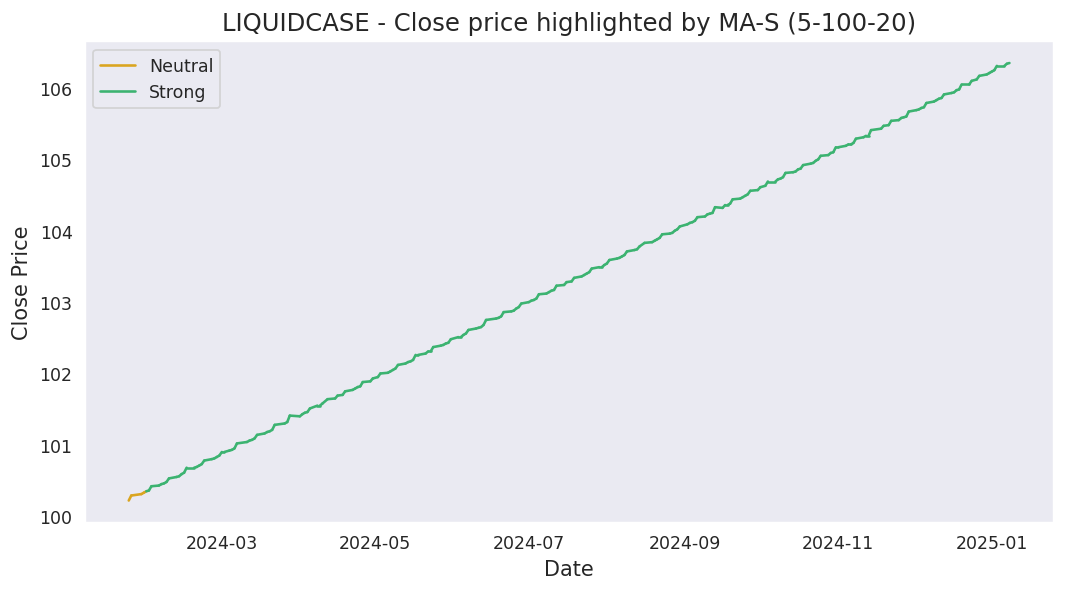
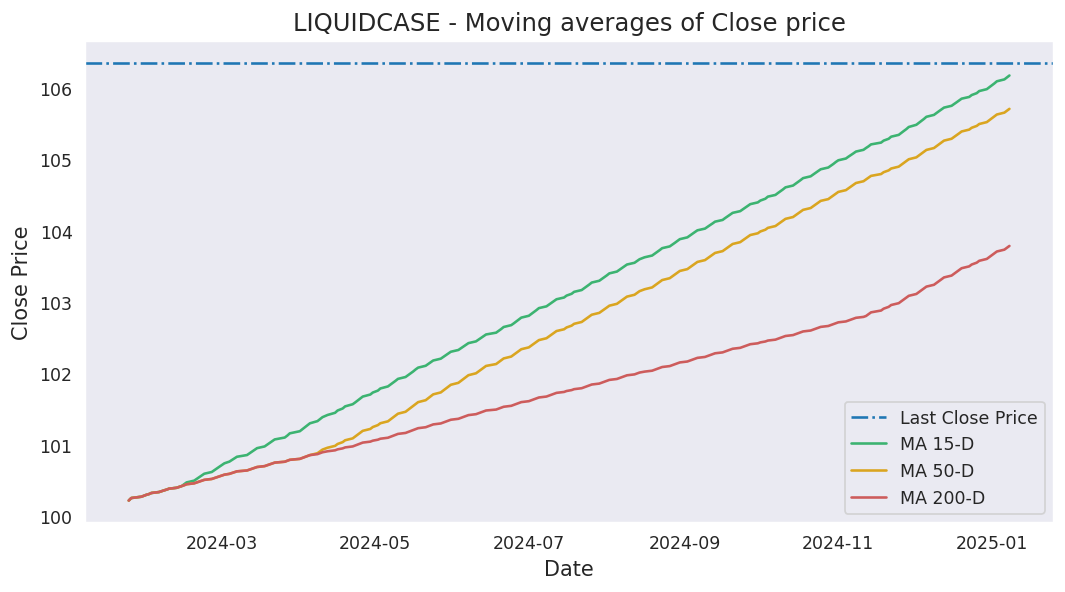
Moving averages
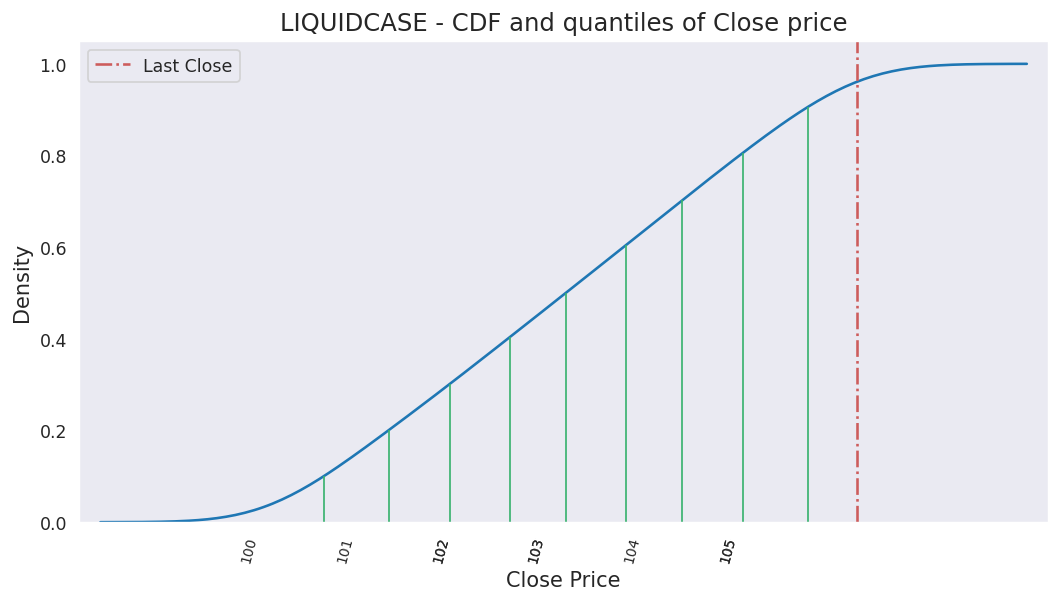
Last close price: 114.63
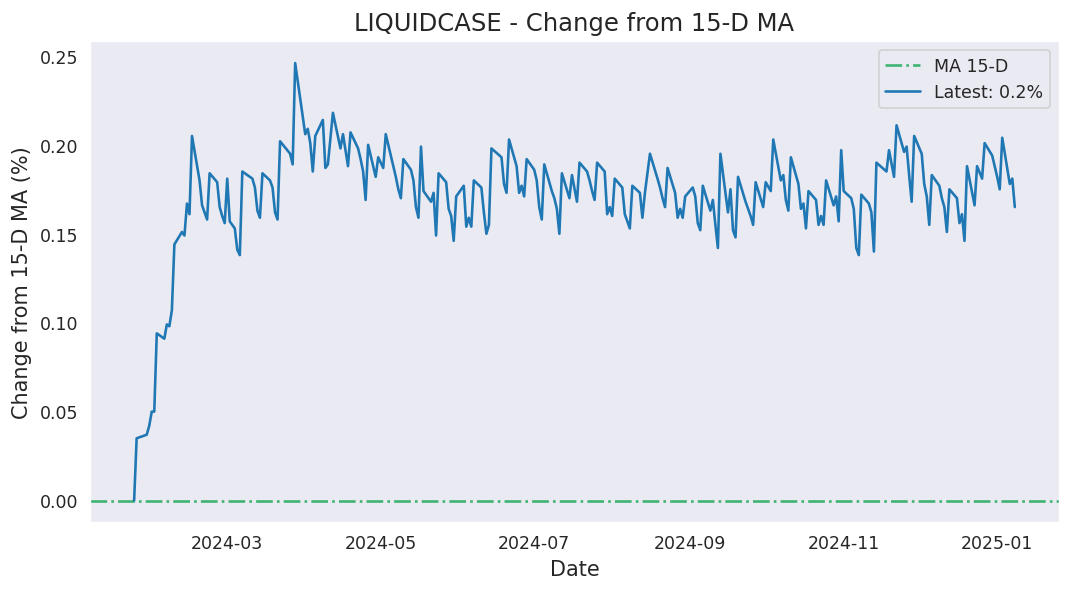
Average of last 15 days: 114.47
Average of last 50 days: 114.07
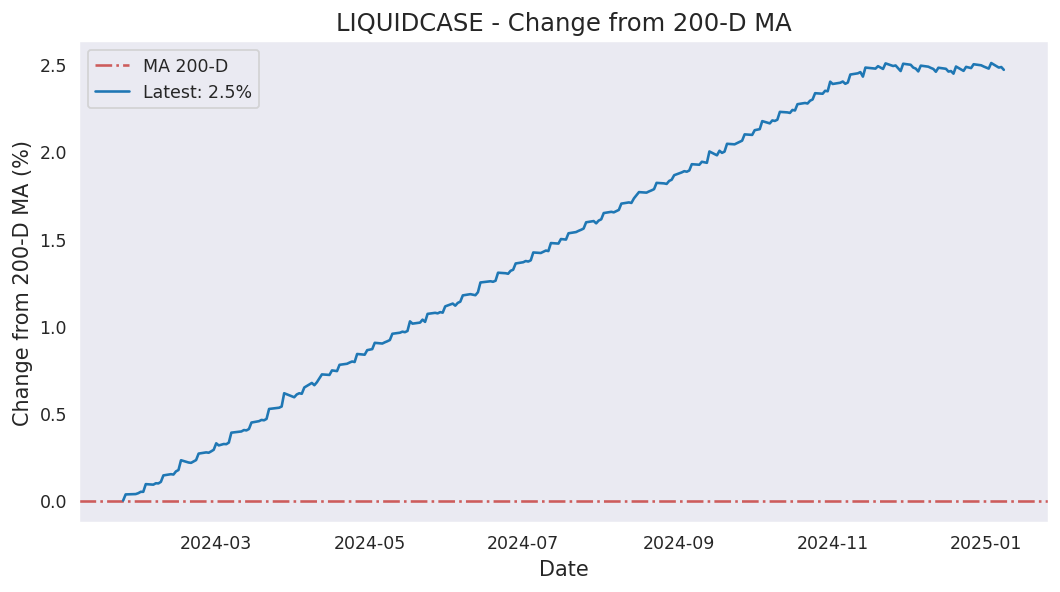
Average of last 200 days: 112.39
Analysis based on 595 records from January 24, 2024 to June 19, 2026
Last updated on June 19, 2026
| 5 Days | 15 Days | 50 Days | 200 Days | 595 Days | |
|---|---|---|---|---|---|
| Start Date | June 15, 2026 | June 01, 2026 | April 08, 2026 | August 28, 2025 | January 24, 2024 |
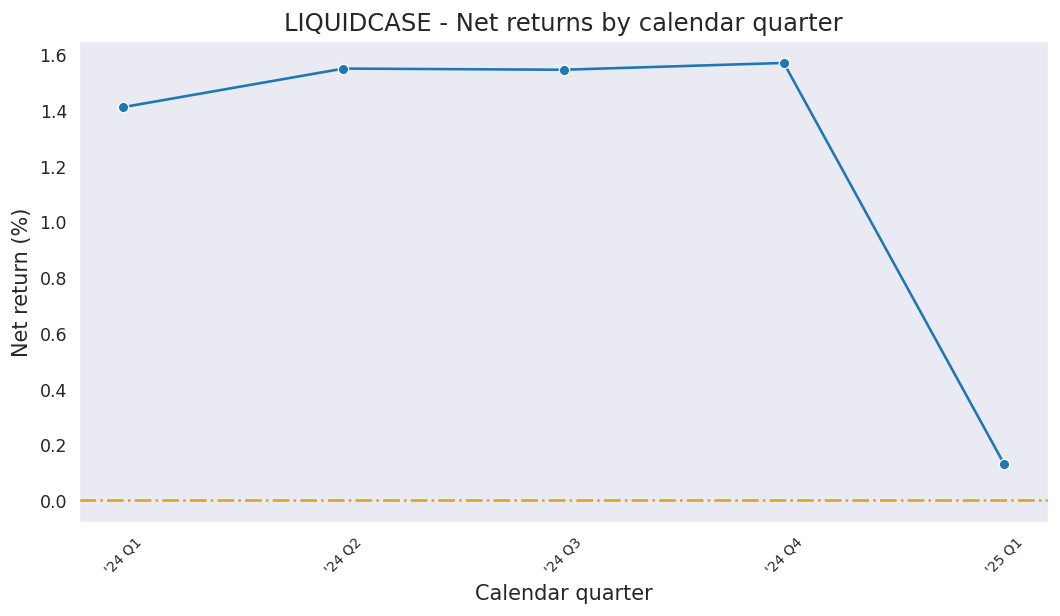
| Net Return | 0.10% | 0.29% | 1.00% | 4.07% | 14.63% |
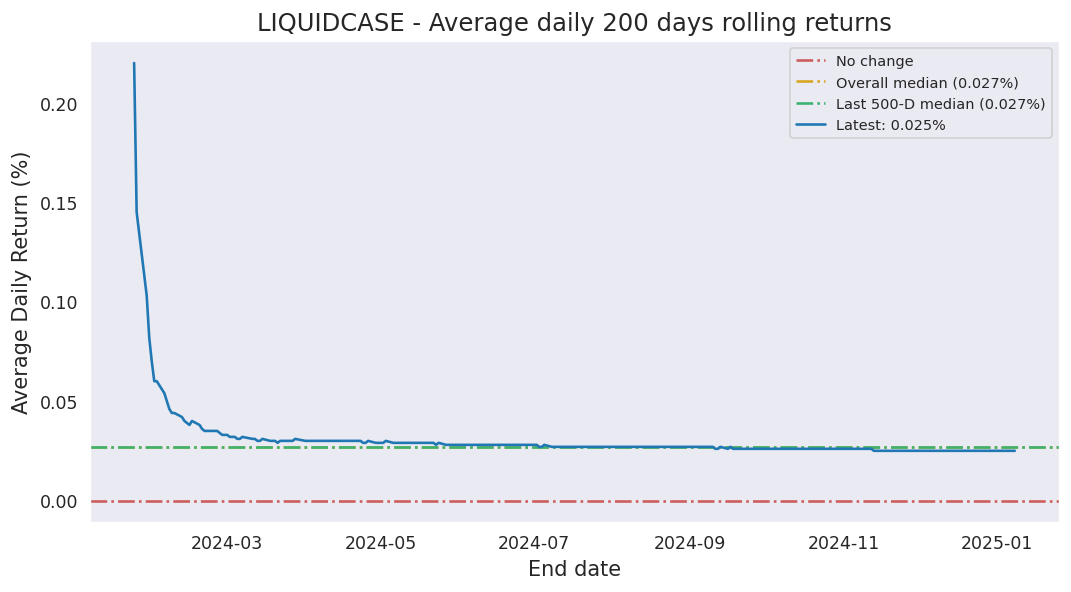
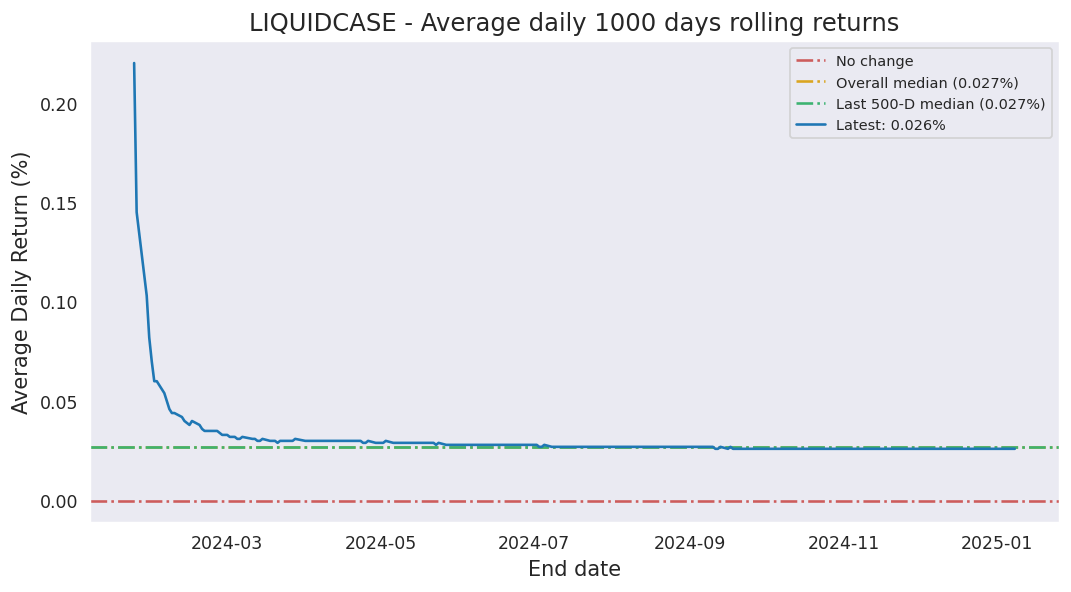
| Average Daily Return | 0.021% | 0.019% | 0.020% | 0.020% | 0.023% |
| Median Close Price | 114.57 | 114.46 | 114.07 | 112.40 | 107.92 |
| Lowest Close Price | 114.53 | 114.33 | 113.52 | 110.15 | 100.22 |
| Highest Close Price | 114.63 | 114.63 | 114.63 | 114.63 | 114.63 |
| Mean Value Traded | 1.88B | 1.86B | 2.37B | 1.89B | 1.11B |
Last close price: 114.63
Average of last 15 days: 114.47
Average of last 50 days: 114.07
Average of last 200 days: 112.39
This is the first time LIQUIDCASE has closed at this high a price.
Since then, it has closed over this price 100.0% of times which is 1 trading days.
Historically, this stock gave a non-positive return for a maximum period of 4 days which was from March 28, 2024 to April 01, 2024.
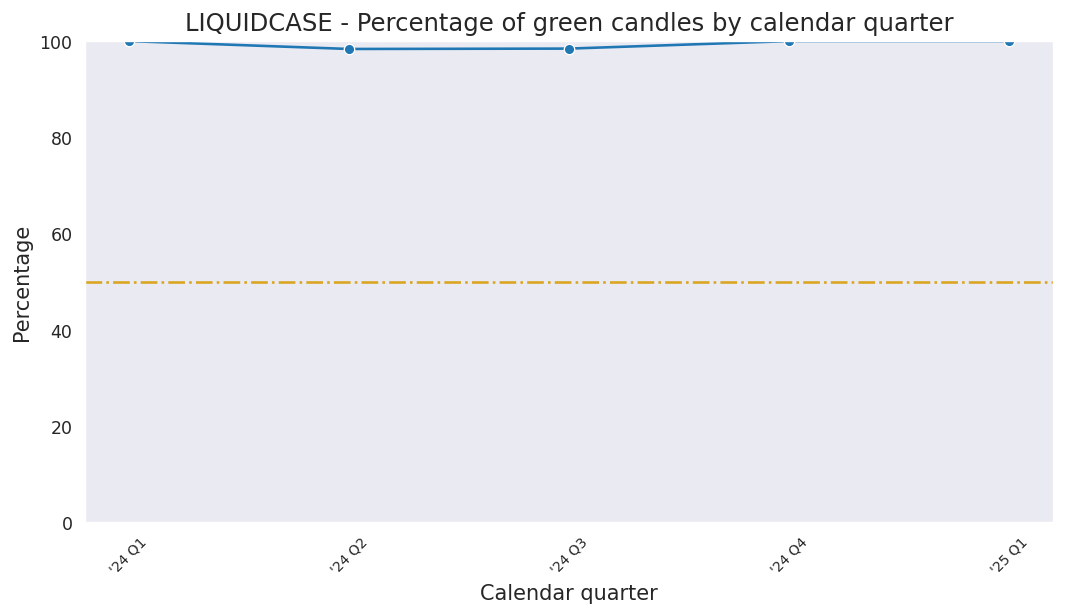
Last candle: Green (0.03%)
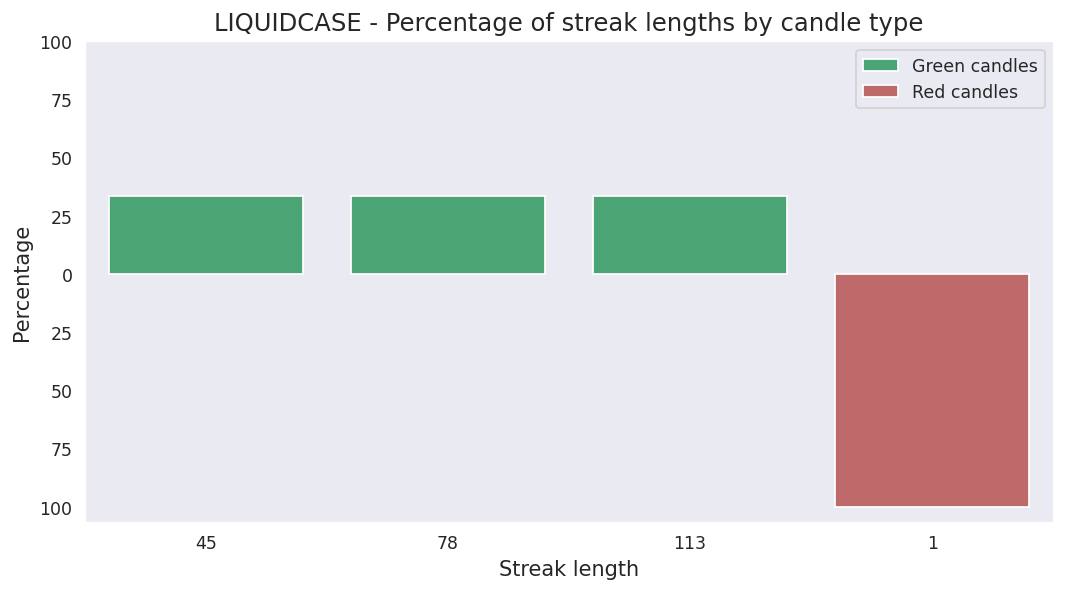
Overall percentage of Green candles: 99.3%
Current streak of Green candles: 192
Net change so far for the current streak: 3.91%
Probability of streak continuing: 0.0%
Longest streak of Green candles: 192 trading days from September 09, 2025 to June 19, 2026
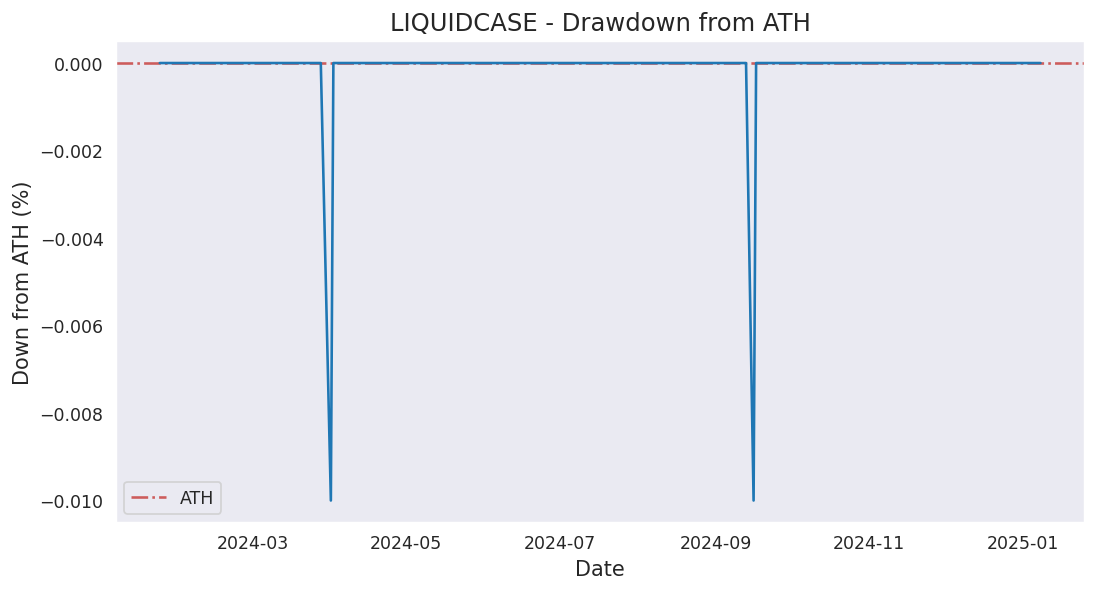
Current down from ATH: 0.00%
Most down from ATH: -0.01%
ATH hits in last 1000 days: 591
ATH was last hit on Friday, June 19, 2026.