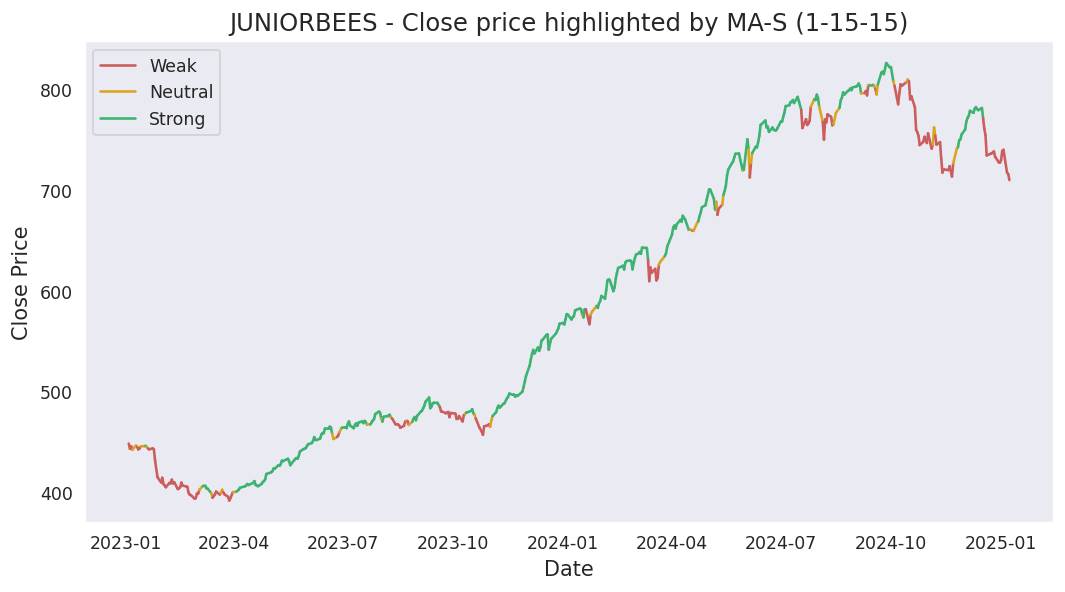
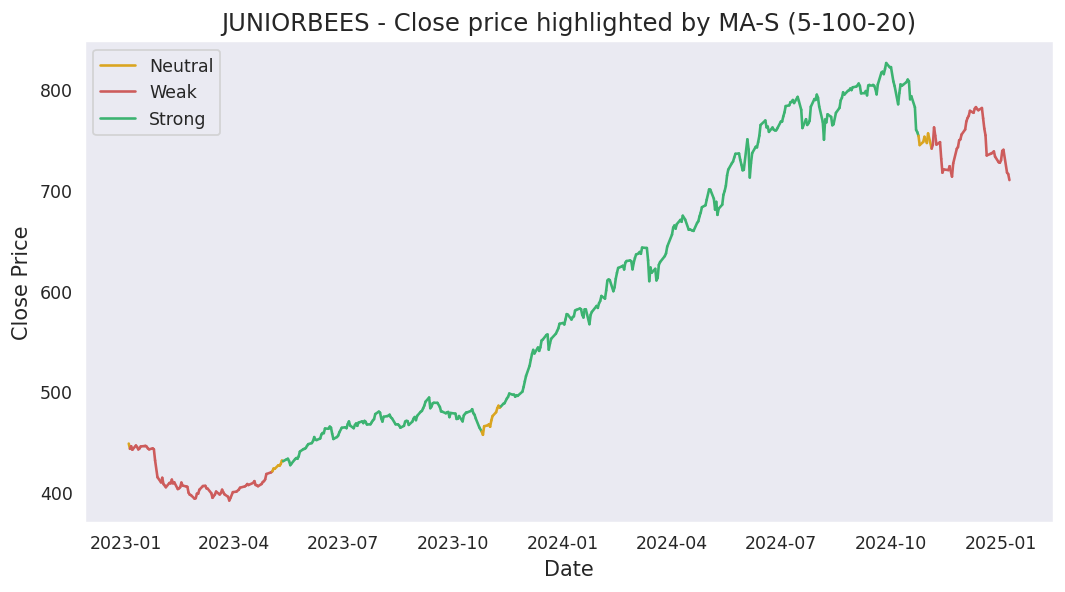
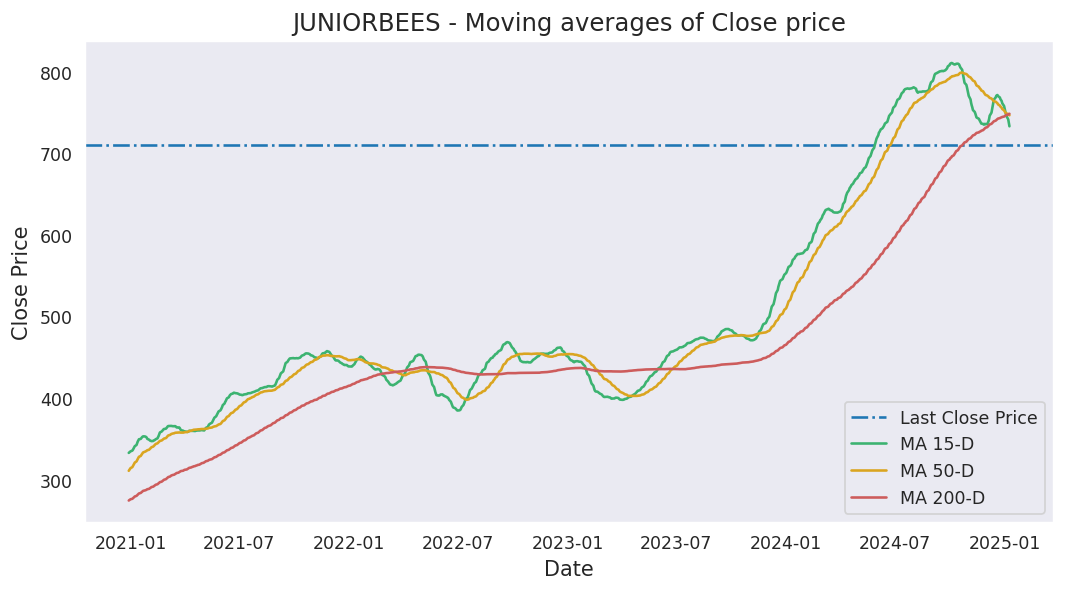
Moving averages
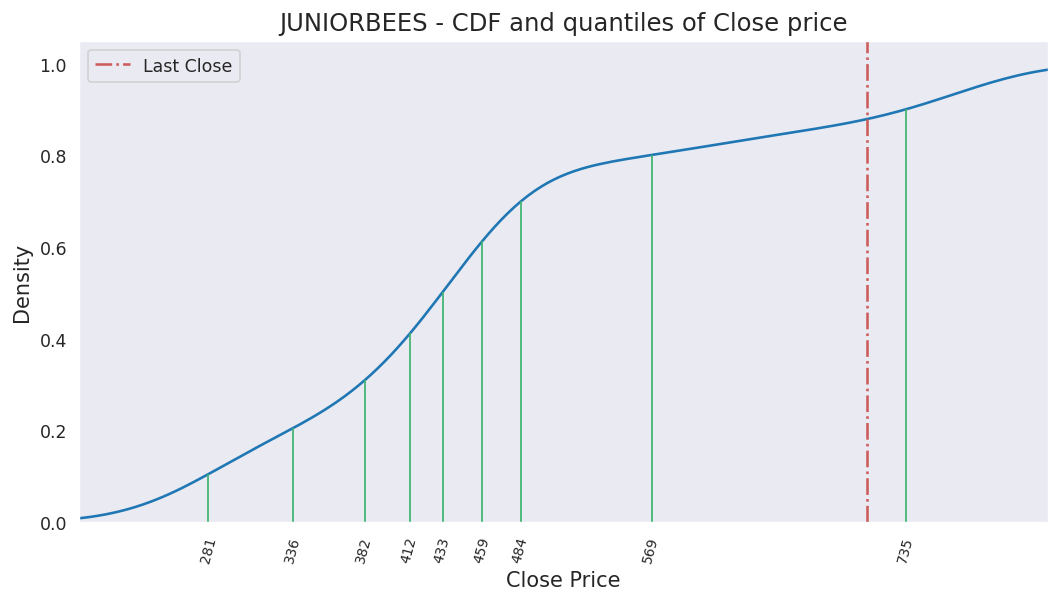
Last close price: 781.04
Average of last 15 days: 760.92
Average of last 50 days: 755.45
Average of last 200 days: 738.48
Analysis based on 1606 records from January 01, 2020 to June 19, 2026
Last updated on June 19, 2026
| 5 Days | 15 Days | 50 Days | 200 Days | 1000 Days | |
|---|---|---|---|---|---|
| Start Date | June 15, 2026 | June 01, 2026 | April 08, 2026 | August 28, 2025 | June 08, 2022 |
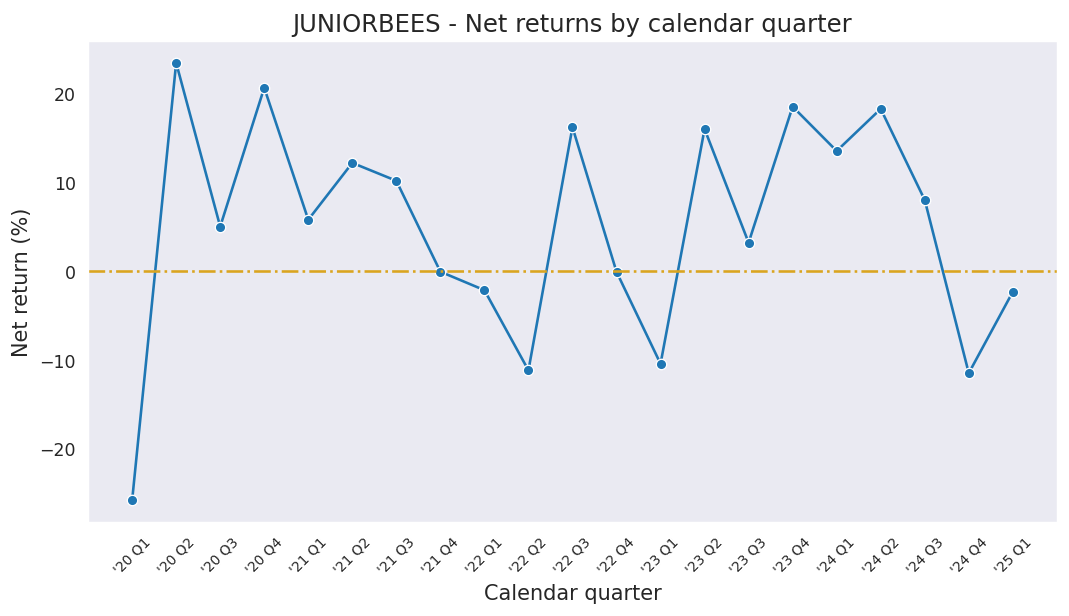
| Net Return | 3.35% | 1.72% | 14.71% | 8.69% | 95.56% |
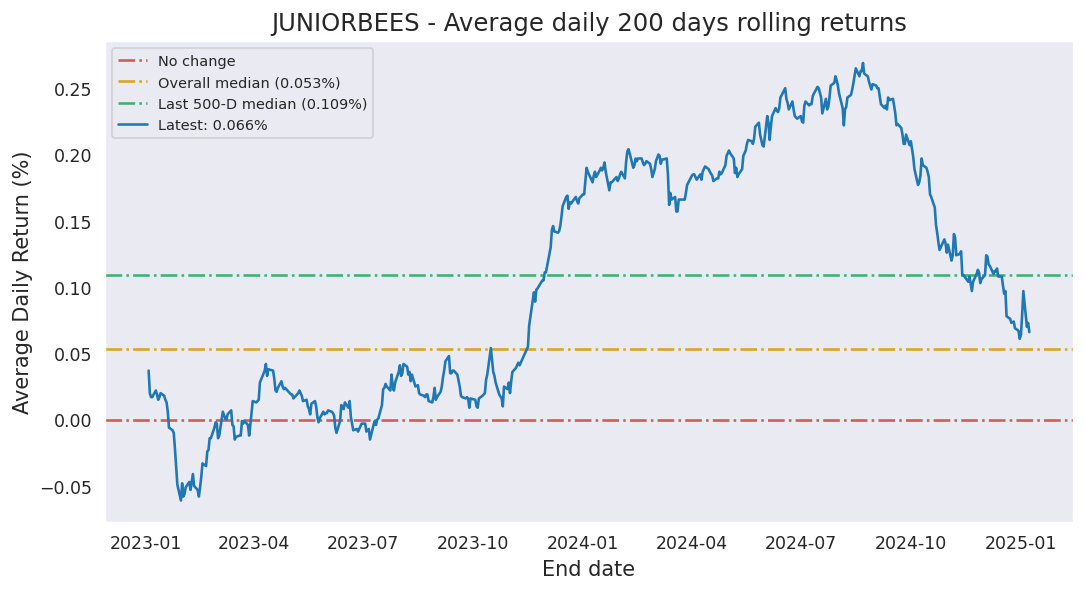
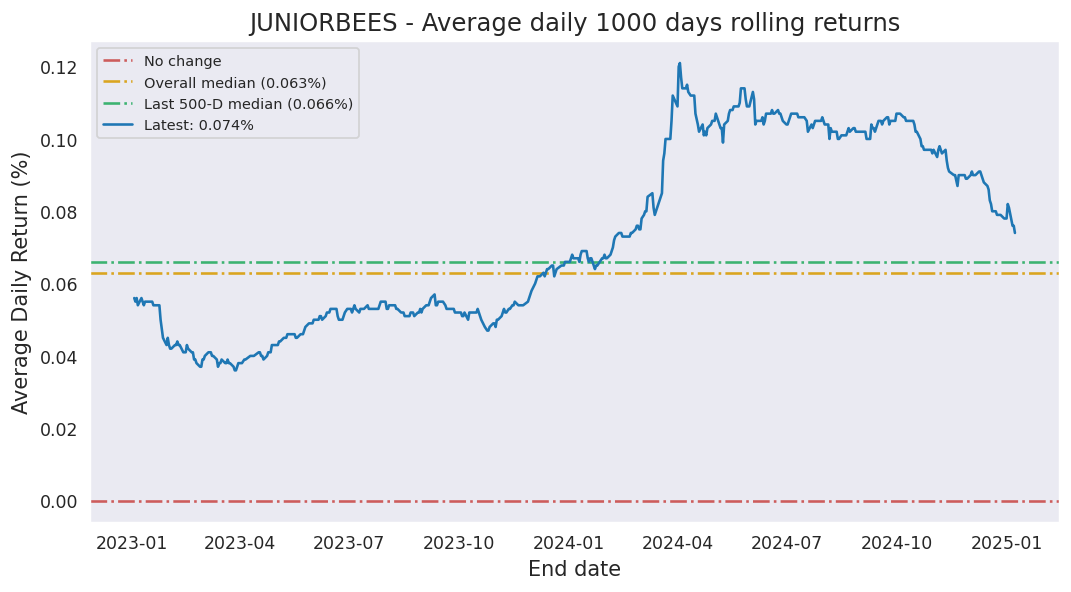
| Average Daily Return | 0.661% | 0.114% | 0.275% | 0.042% | 0.067% |
| Median Close Price | 779.84 | 756.08 | 756.32 | 741.83 | 667.87 |
| Lowest Close Price | 773.42 | 738.48 | 713.54 | 651.90 | 374.26 |
| Highest Close Price | 783.47 | 783.47 | 783.47 | 783.47 | 825.86 |
| Mean Value Traded | 346.98M | 331.69M | 355.61M | 320.02M | 176.81M |
Last close price: 781.04
Average of last 15 days: 760.92
Average of last 50 days: 755.45
Average of last 200 days: 738.48
JUNIORBEES first closed above its last close price on Friday, July 05, 2024 which was 714 days ago.
Since then, it has closed over this price 13.0% of times which is 63 trading days.
Previously, JUNIORBEES closed above its last close price on Thursday, June 18, 2026 which was 1 days ago.
Historically, this stock gave a non-positive return for a maximum period of 748 days which was from October 14, 2021 to November 01, 2023.
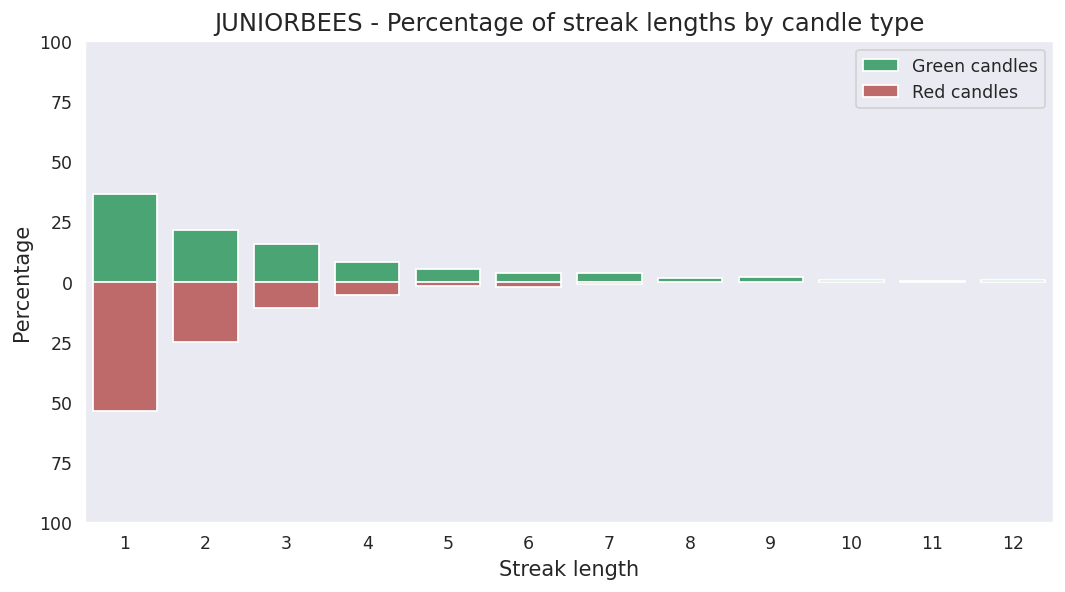
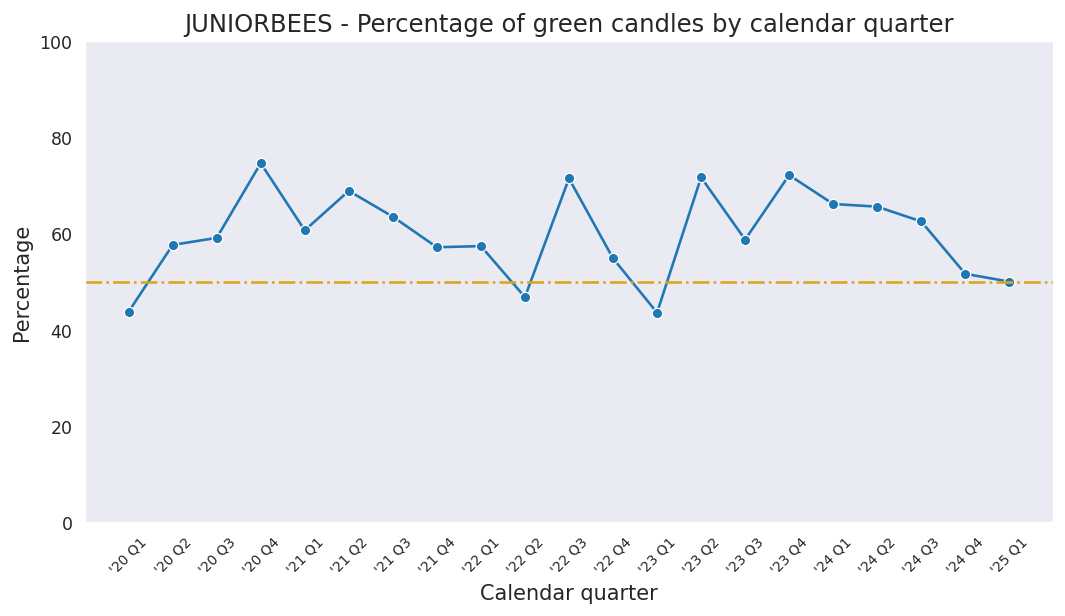
Last candle: Red (-0.31%)
Overall percentage of Red candles: 40.6%
Current streak of Red candles: 1
Net change so far for the current streak: -0.31%
Probability of streak continuing: 49.7%
Longest streak of Red candles: 7 trading days from February 17, 2023 to February 27, 2023
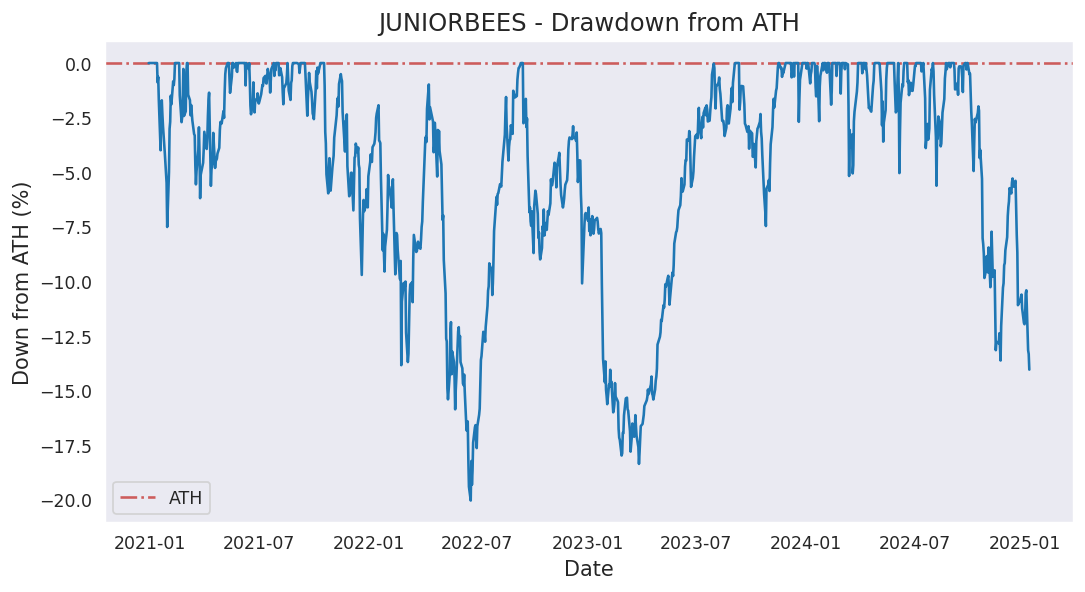
Current down from ATH: -5.43%
Most down from ATH: -34.51%
ATH hits in last 1000 days: 100
ATH was last hit on Friday, September 27, 2024.