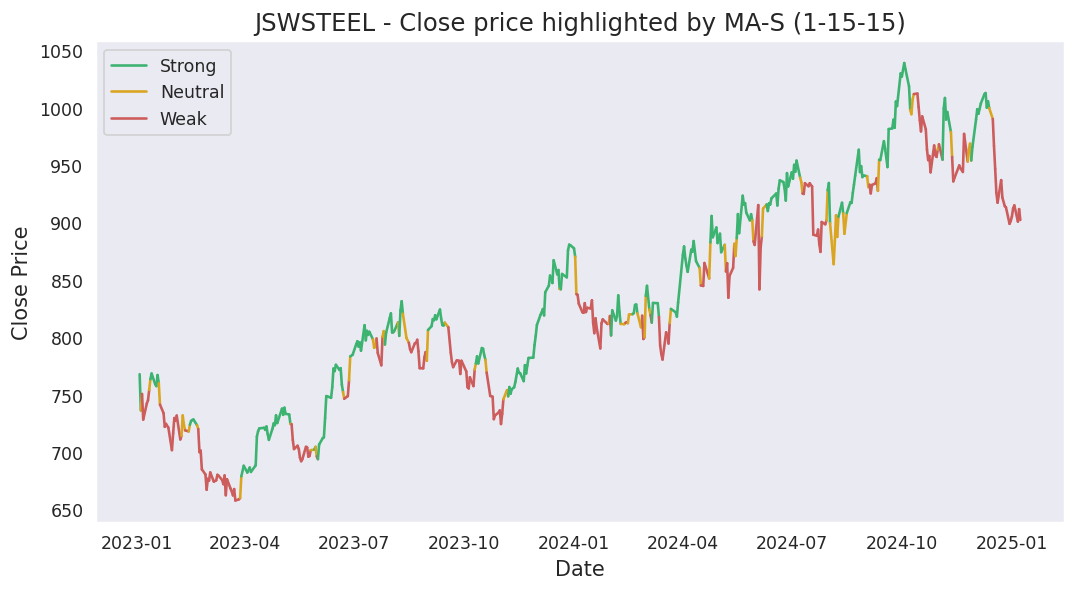
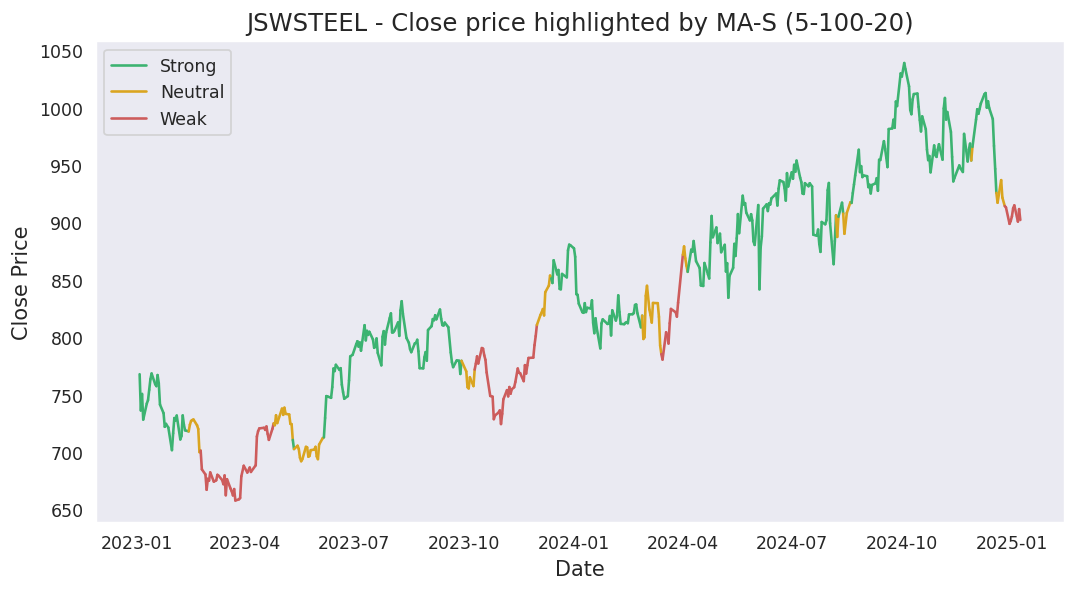
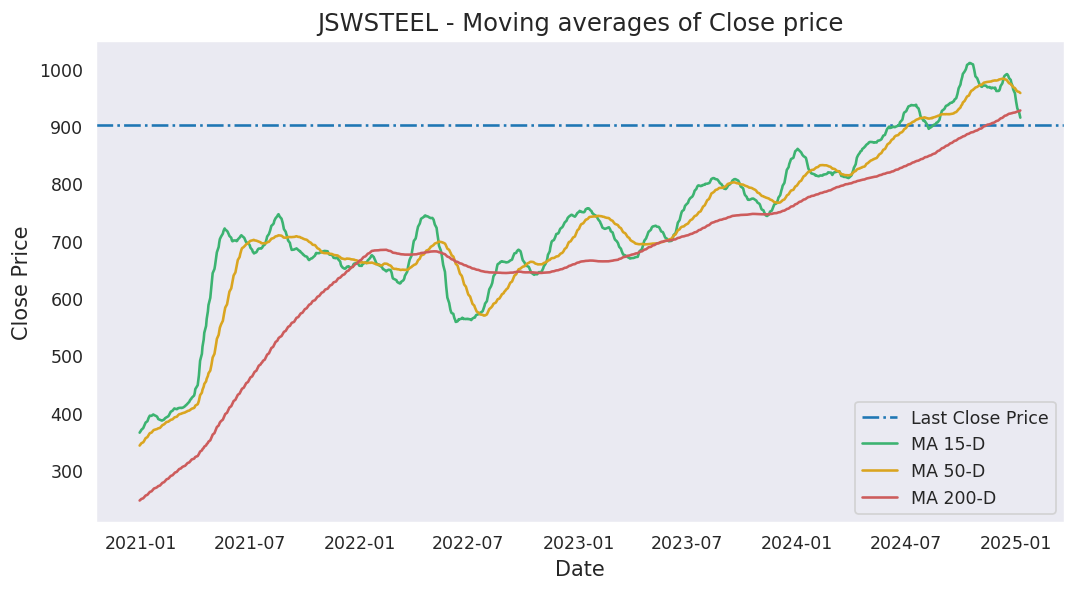
Moving averages
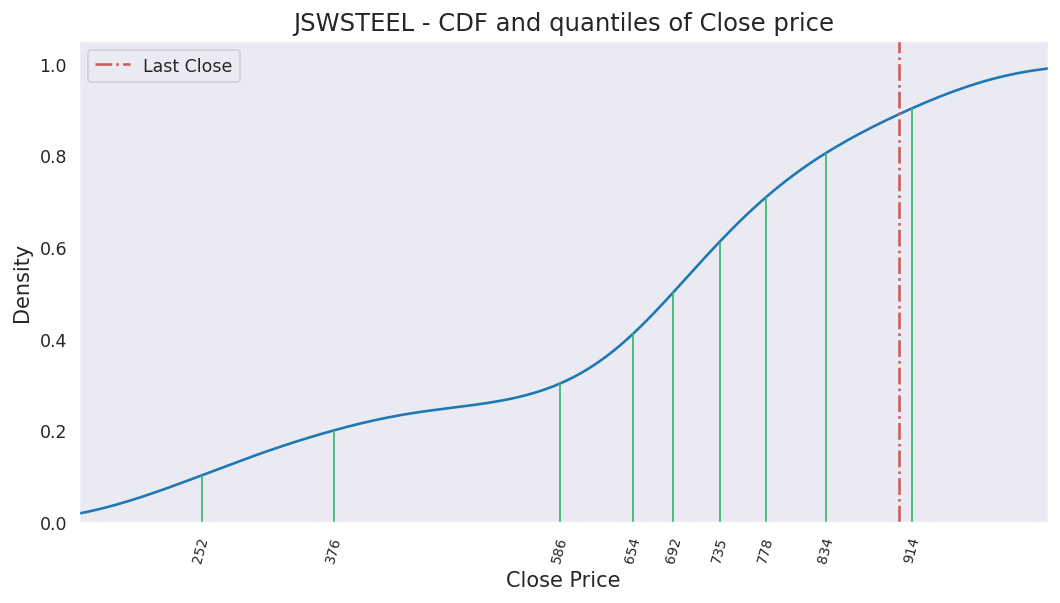
Last close price: 1287.7
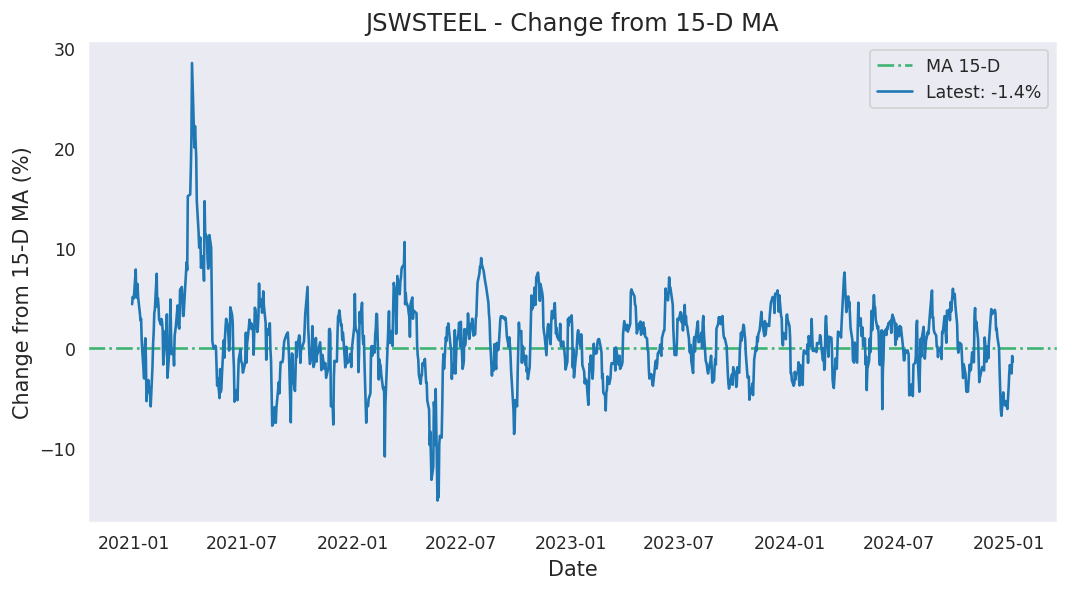
Average of last 15 days: 1287.99
Average of last 50 days: 1271.45
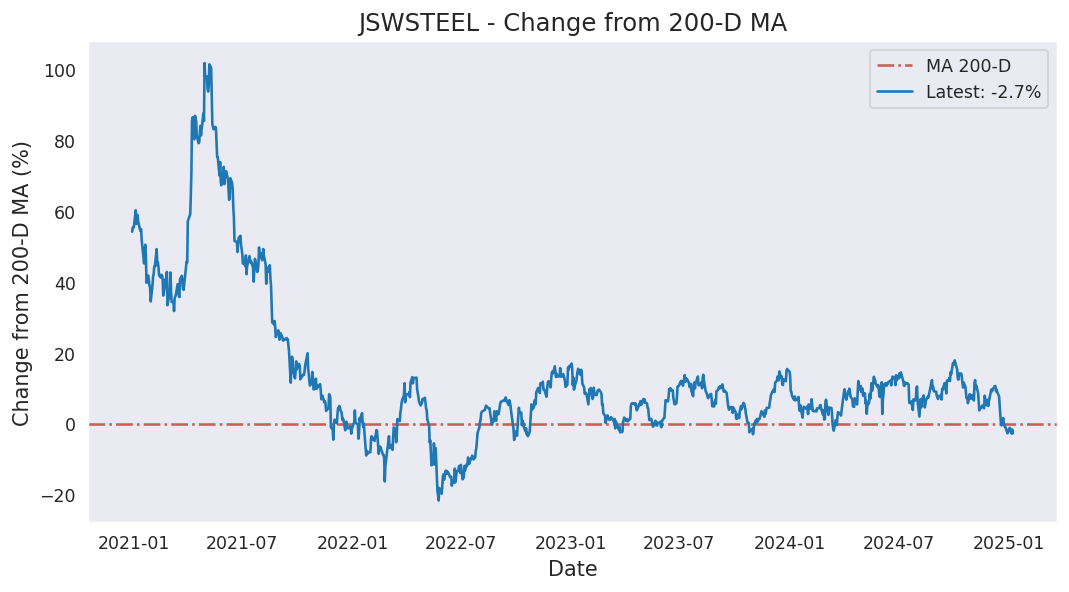
Average of last 200 days: 1188.49
Analysis based on 1606 records from January 01, 2020 to June 19, 2026
Last updated on June 19, 2026
| 5 Days | 15 Days | 50 Days | 200 Days | 1000 Days | |
|---|---|---|---|---|---|
| Start Date | June 15, 2026 | June 01, 2026 | April 08, 2026 | August 28, 2025 | June 08, 2022 |
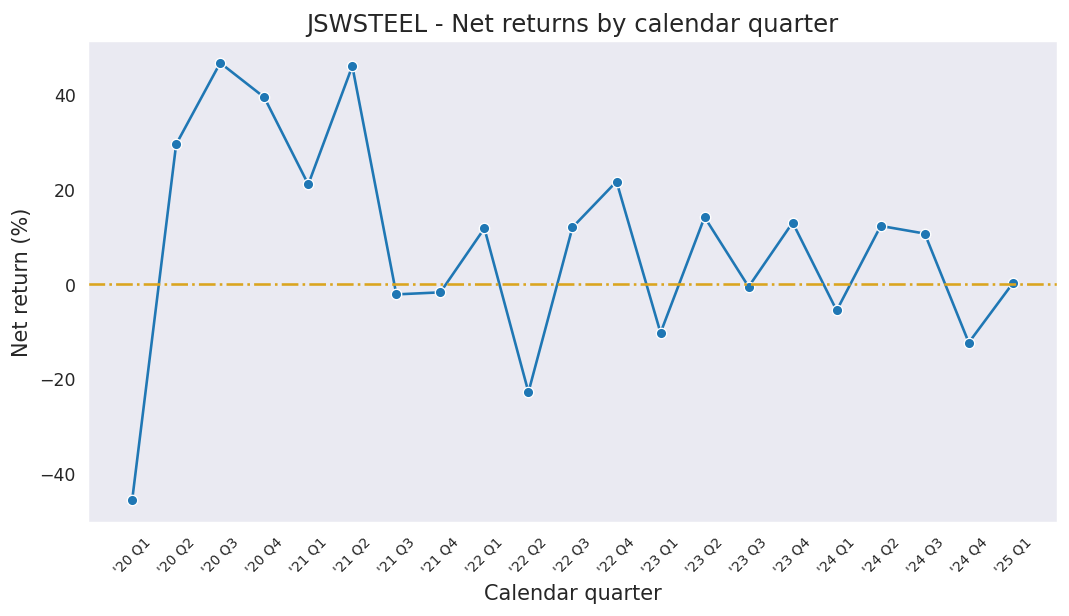
| Net Return | -0.76% | 0.76% | 11.79% | 22.98% | 125.08% |
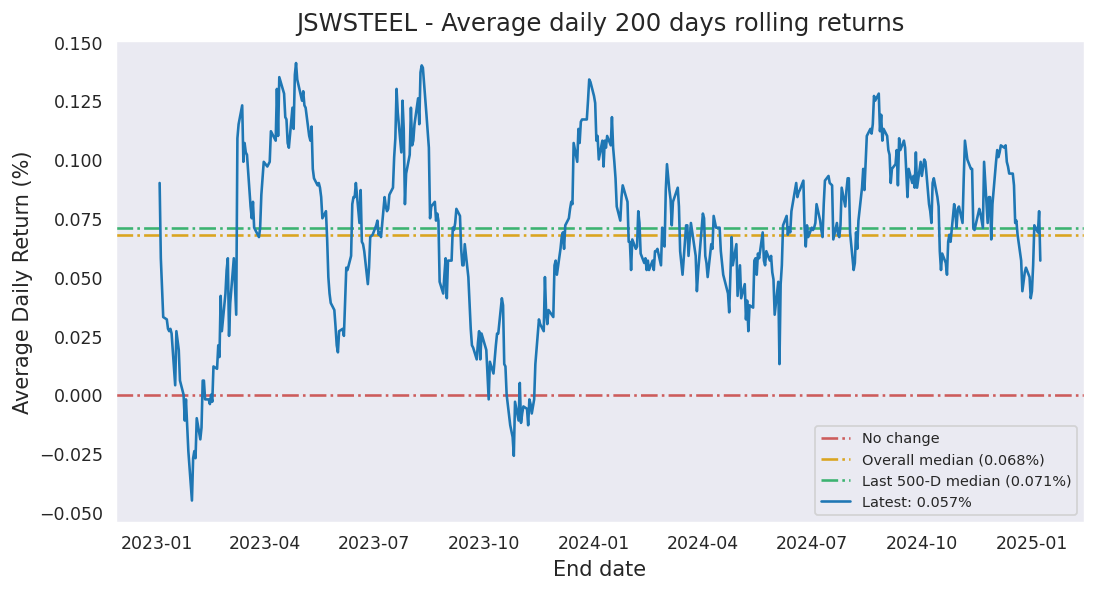
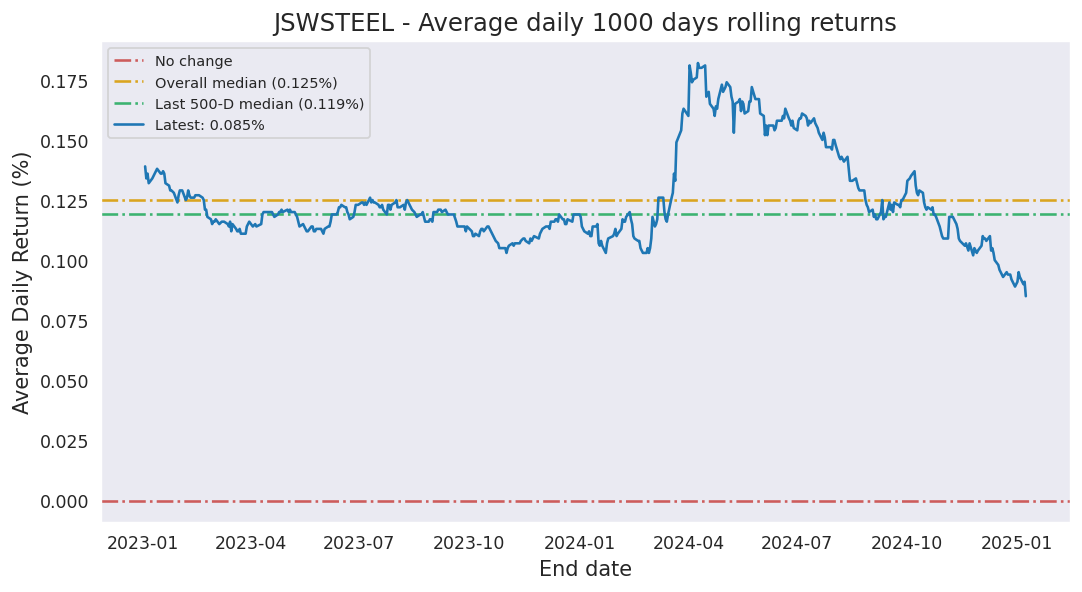
| Average Daily Return | -0.153% | 0.050% | 0.223% | 0.103% | 0.081% |
| Median Close Price | 1287.70 | 1287.70 | 1279.20 | 1179.05 | 899.83 |
| Lowest Close Price | 1274.30 | 1260.70 | 1194.30 | 1026.60 | 545.85 |
| Highest Close Price | 1296.50 | 1312.90 | 1312.90 | 1312.90 | 1312.90 |
| Mean Value Traded | 1.37B | 1.71B | 2.35B | 2.02B | 1.92B |
Last close price: 1287.7
Average of last 15 days: 1287.99
Average of last 50 days: 1271.45
Average of last 200 days: 1188.49
JSWSTEEL first closed above its last close price on Thursday, May 14, 2026 which was 36 days ago.
Since then, it has closed over this price 50.0% of times which is 13 trading days.
Previously, JSWSTEEL closed above its last close price on Thursday, June 18, 2026 which was 1 days ago.
Historically, this stock gave a non-positive return for a maximum period of 919 days which was from May 07, 2021 to November 12, 2023.
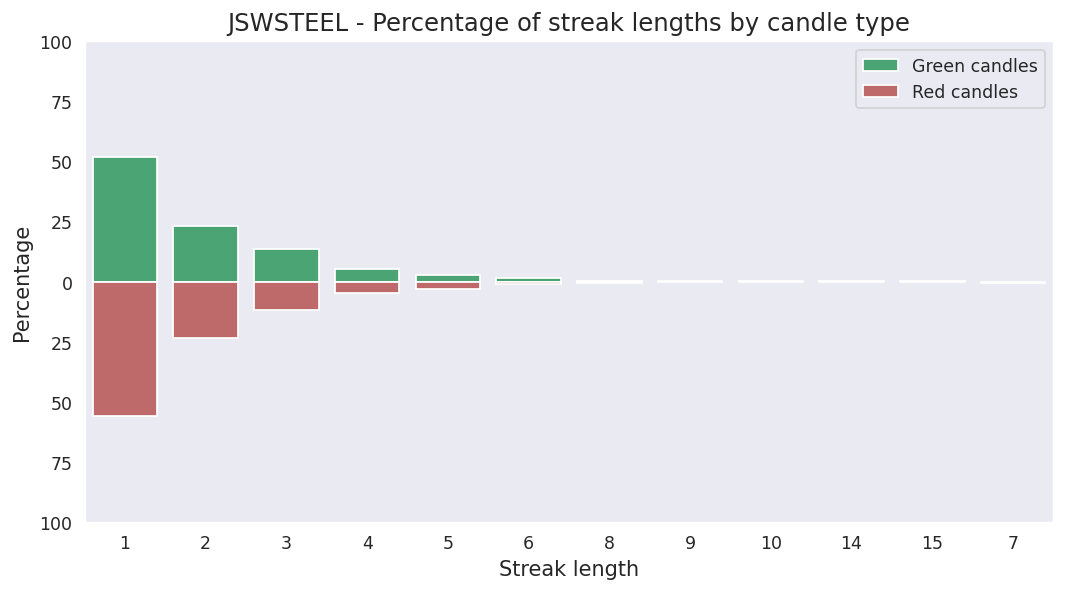
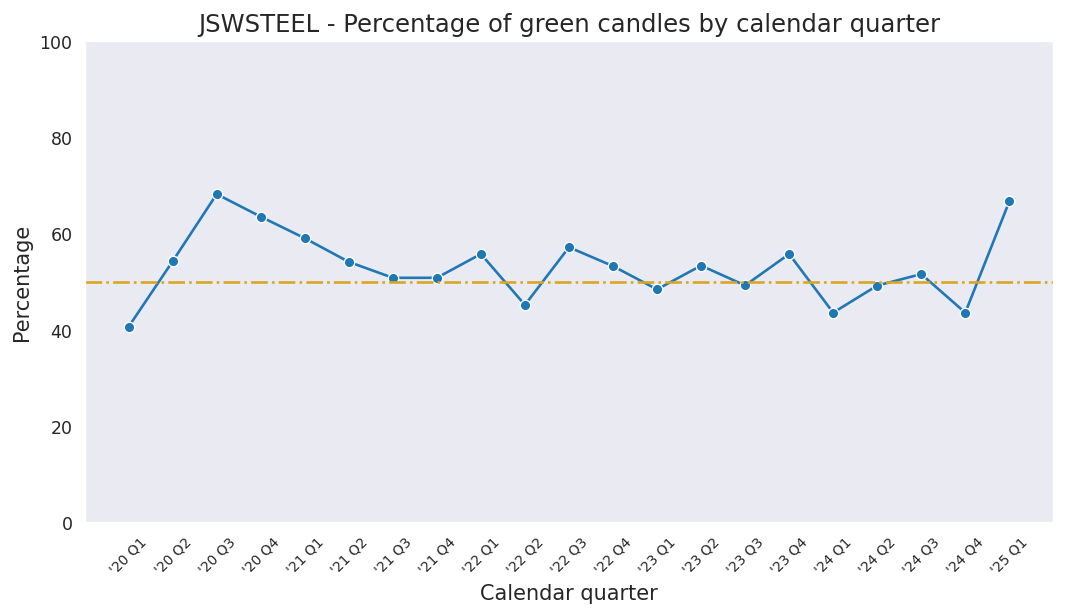
Last candle: Red (-0.48%)
Overall percentage of Red candles: 47.2%
Current streak of Red candles: 1
Net change so far for the current streak: -0.48%
Probability of streak continuing: 44.3%
Longest streak of Red candles: 8 trading days from December 29, 2023 to January 09, 2024
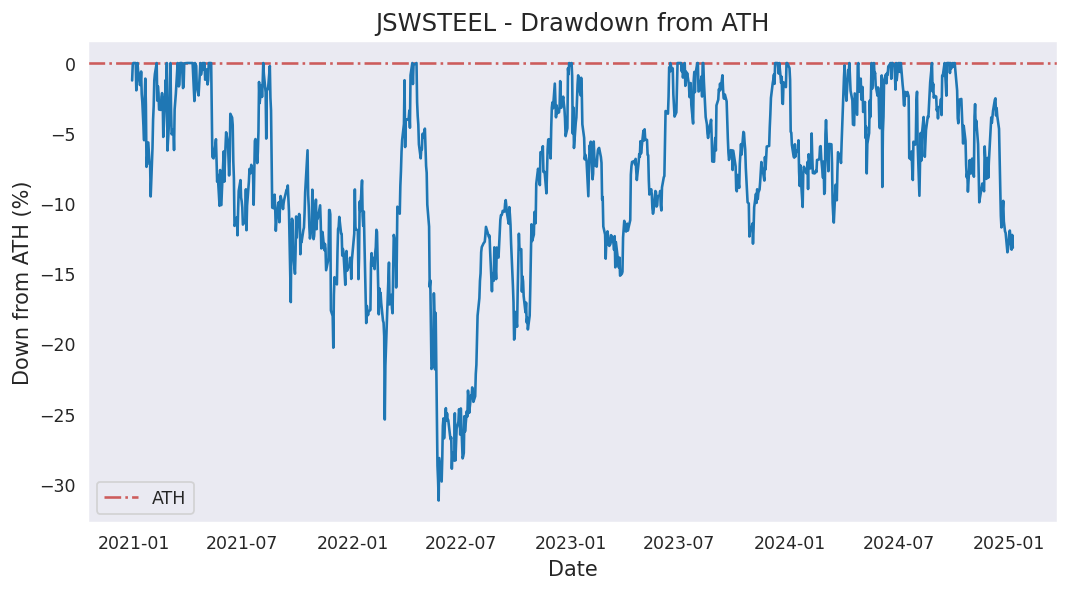
Current down from ATH: -1.92%
Most down from ATH: -52.09%
ATH hits in last 1000 days: 72
ATH was last hit on Wednesday, June 03, 2026.