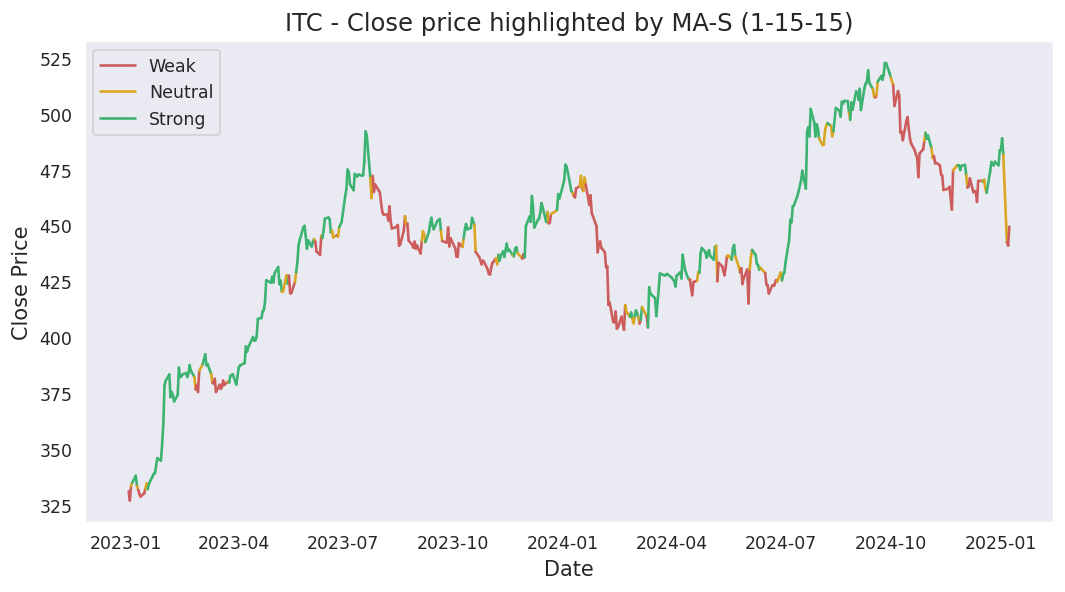
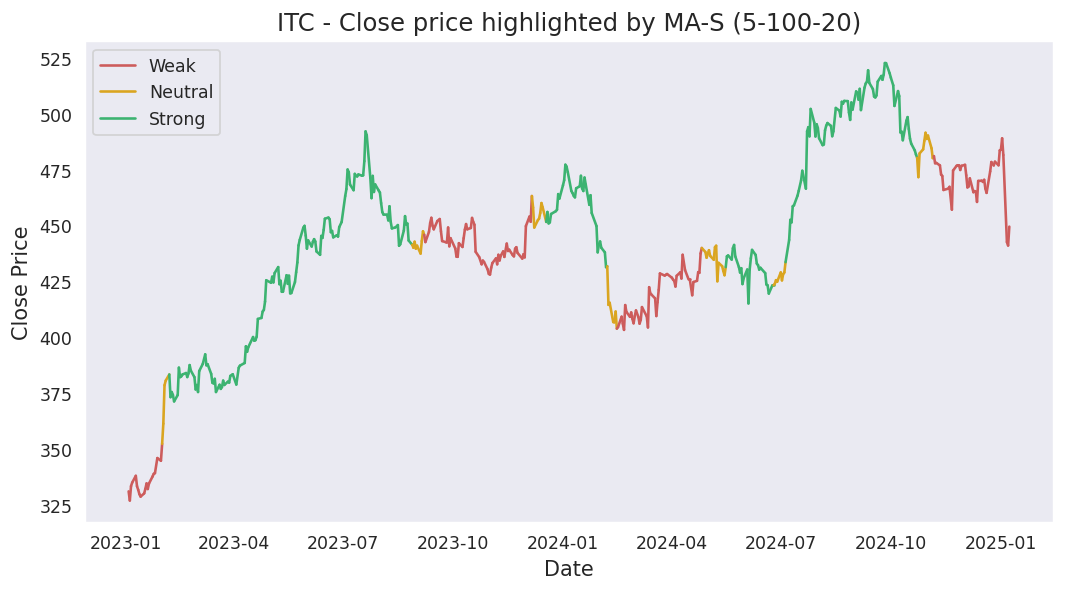
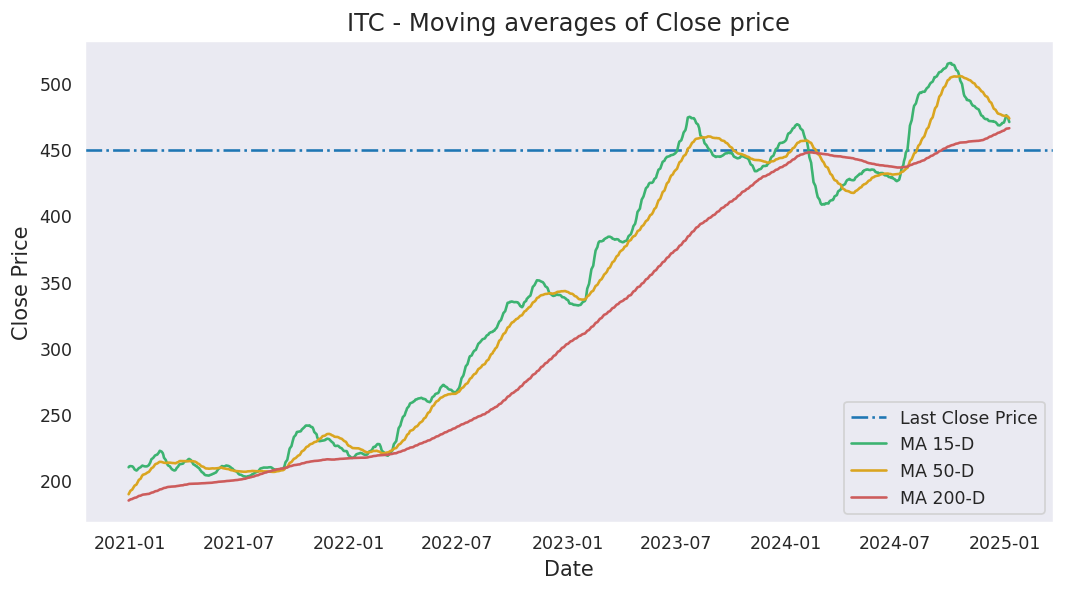
Moving averages
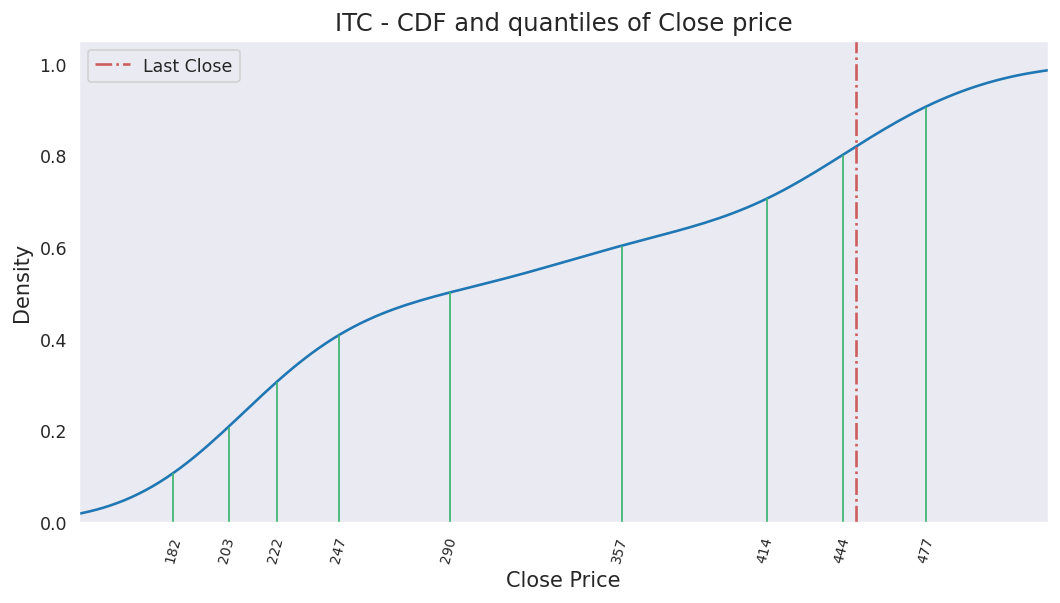
Last close price: 292.5
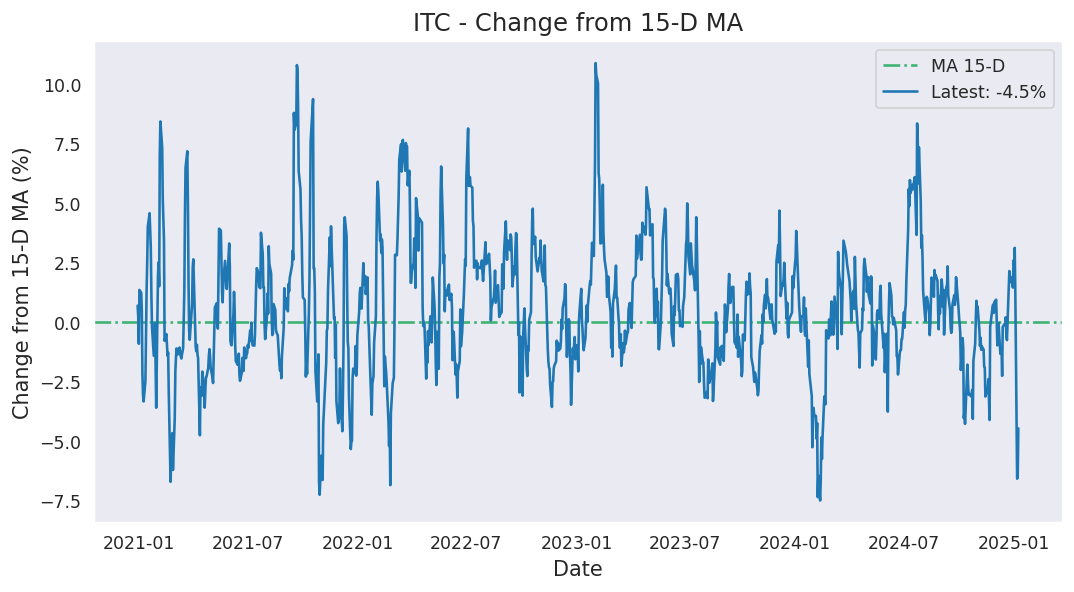
Average of last 15 days: 284.36
Average of last 50 days: 299.01
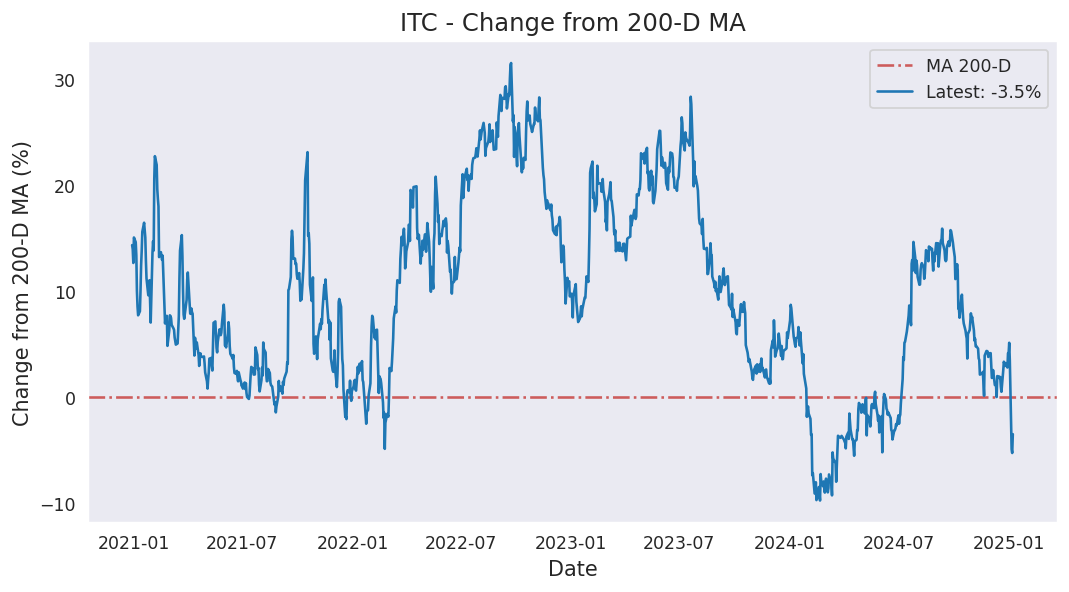
Average of last 200 days: 351.11
Analysis based on 1606 records from January 01, 2020 to June 19, 2026
Last updated on June 19, 2026
| 5 Days | 15 Days | 50 Days | 200 Days | 1000 Days | |
|---|---|---|---|---|---|
| Start Date | June 15, 2026 | June 01, 2026 | April 08, 2026 | August 28, 2025 | June 08, 2022 |
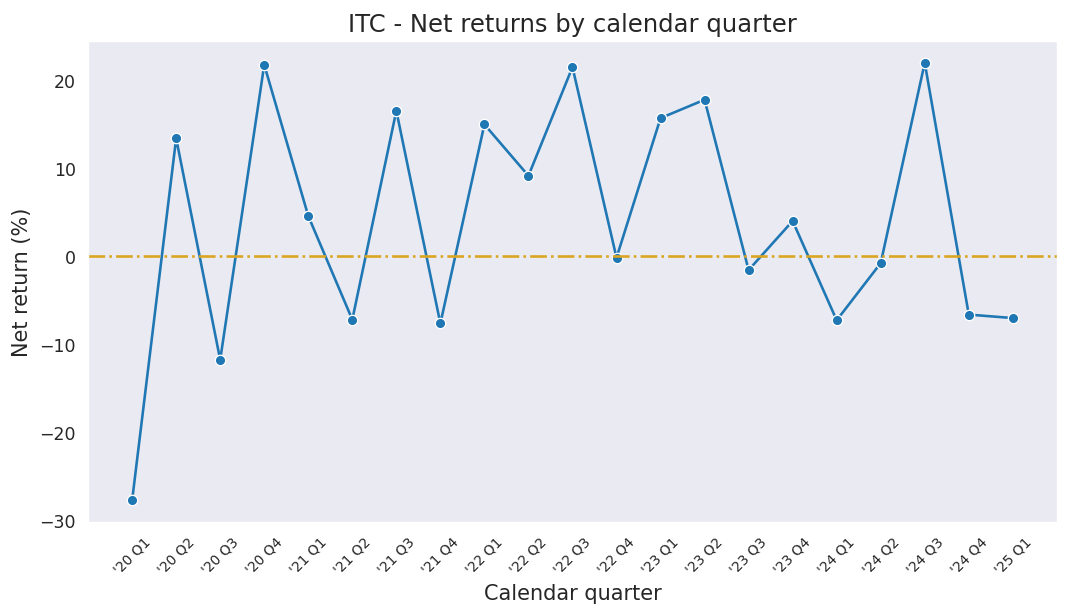
| Net Return | 2.60% | 1.95% | -1.99% | -27.48% | 6.79% |
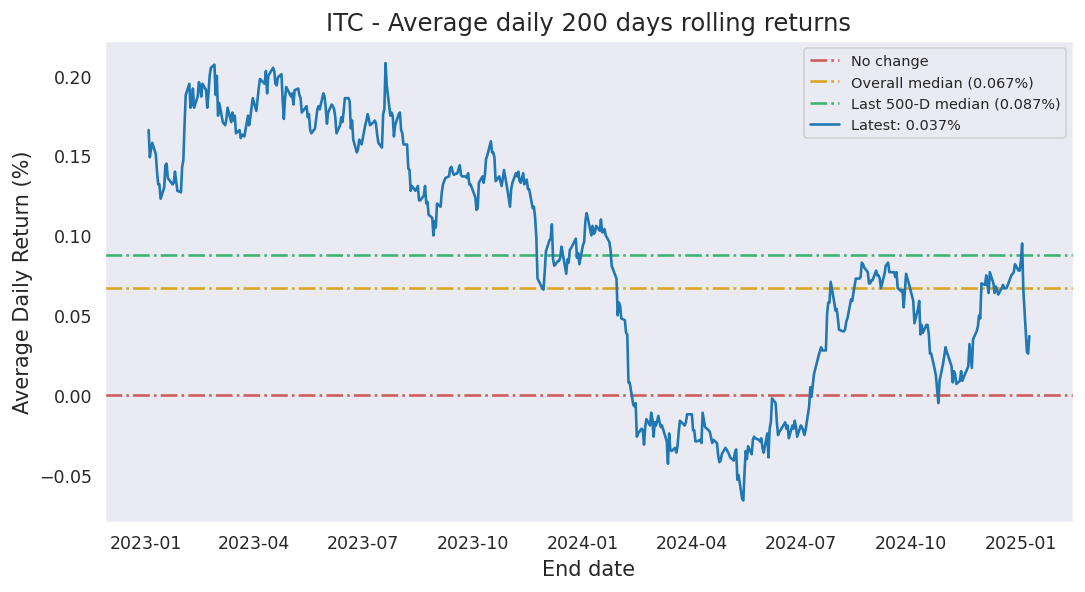
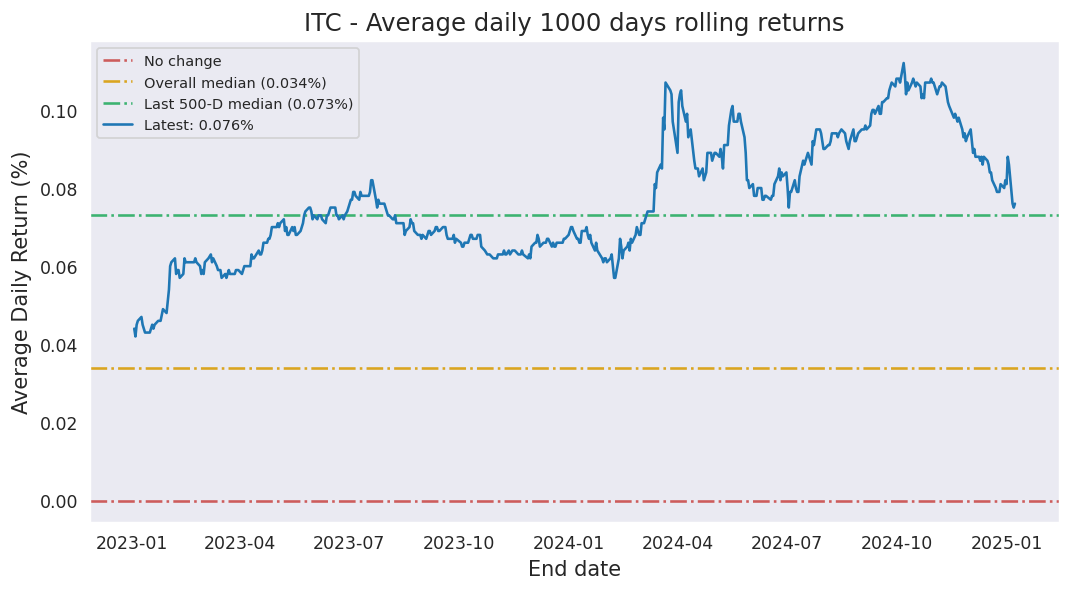
| Average Daily Return | 0.514% | 0.129% | -0.040% | -0.161% | 0.007% |
| Median Close Price | 291.15 | 283.25 | 303.20 | 326.65 | 415.35 |
| Lowest Close Price | 287.90 | 277.00 | 277.00 | 277.00 | 260.70 |
| Highest Close Price | 292.50 | 292.50 | 316.25 | 421.60 | 522.75 |
| Mean Value Traded | 3.40B | 4.56B | 5.58B | 6.70B | 5.94B |
Last close price: 292.5
Average of last 15 days: 284.36
Average of last 50 days: 299.01
Average of last 200 days: 351.11
ITC first closed above its last close price on Friday, July 08, 2022 which was 1442 days ago.
Since then, it has closed over this price 97.9% of times which is 957 trading days.
Previously, ITC closed above its last close price on Tuesday, May 26, 2026 which was 24 days ago.
Historically, this stock gave a non-positive return for a maximum period of 1481 days which was from May 20, 2022 to June 09, 2026.
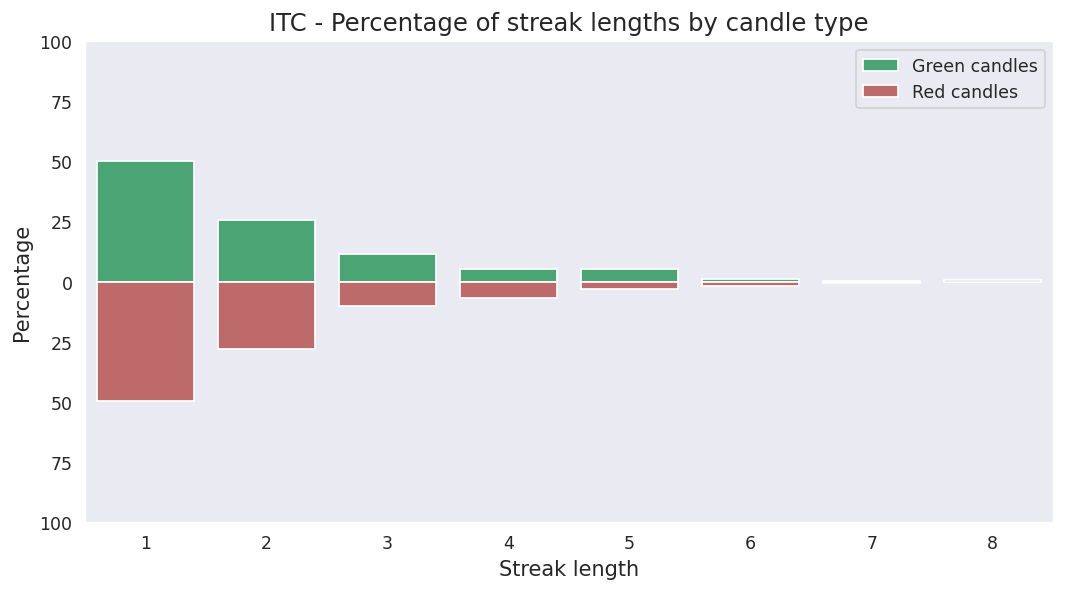
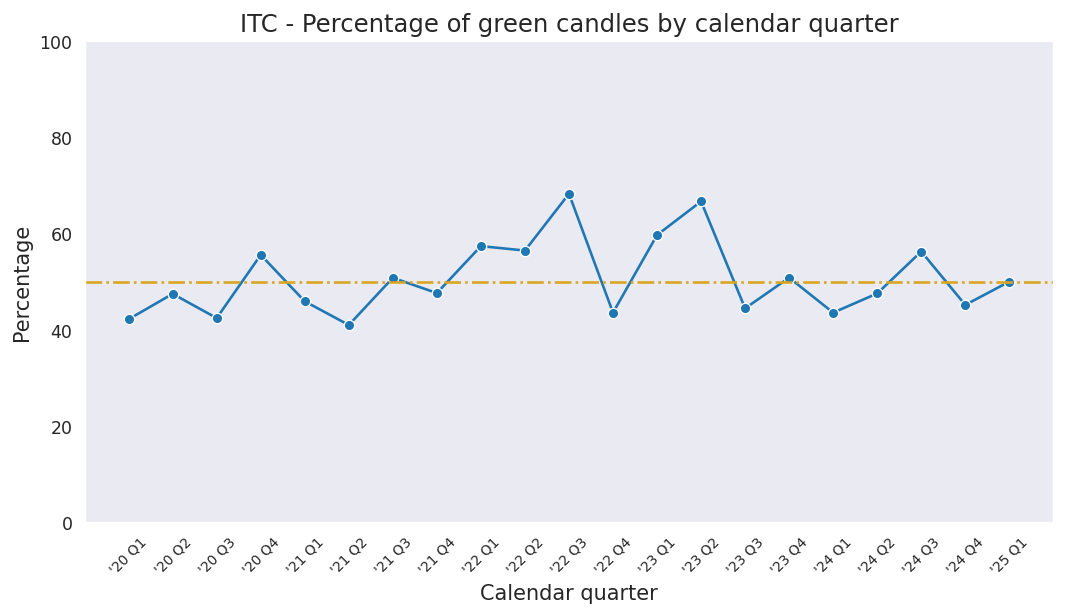
Last candle: Green (0.46%)
Overall percentage of Green candles: 49.7%
Current streak of Green candles: 2
Net change so far for the current streak: 0.60%
Probability of streak continuing: 50.2%
Longest streak of Green candles: 8 trading days from May 19, 2023 to May 30, 2023
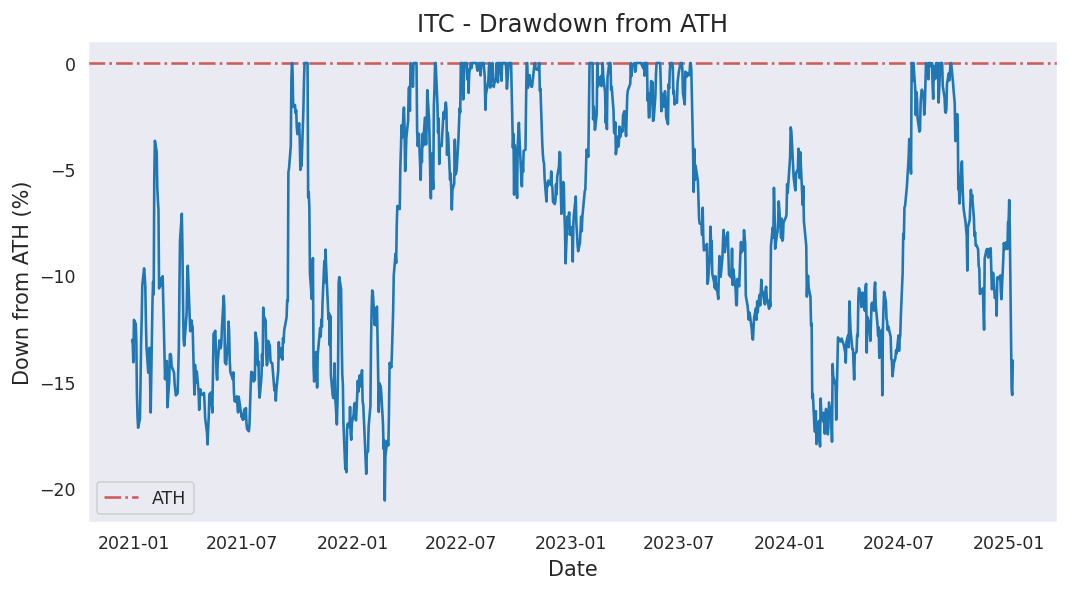
Current down from ATH: -44.05%
Most down from ATH: -47.01%
ATH hits in last 1000 days: 79
ATH was last hit on Thursday, September 26, 2024.