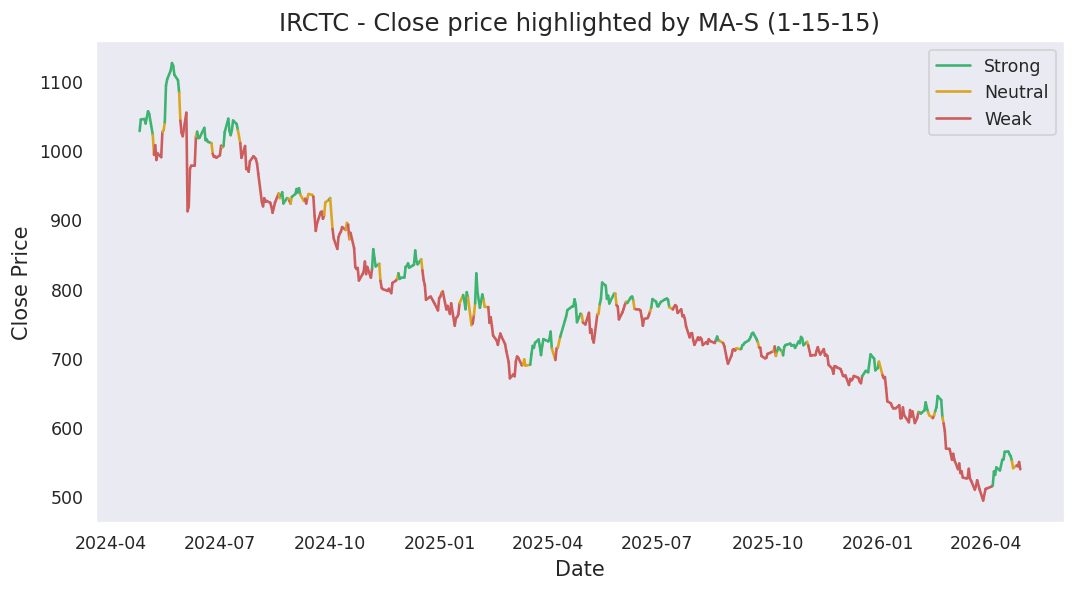
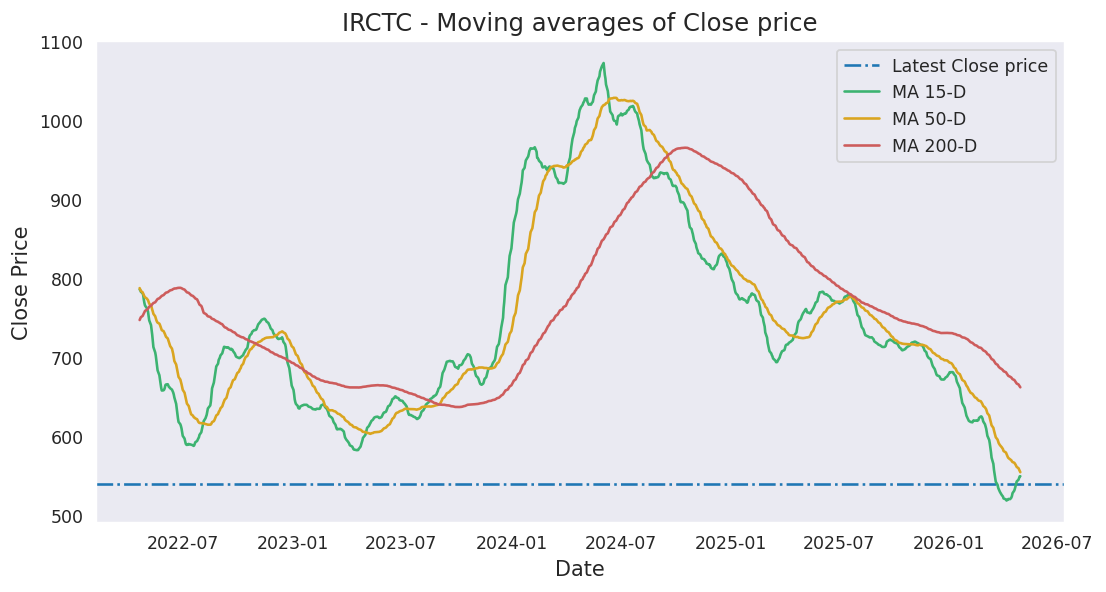
Moving averages
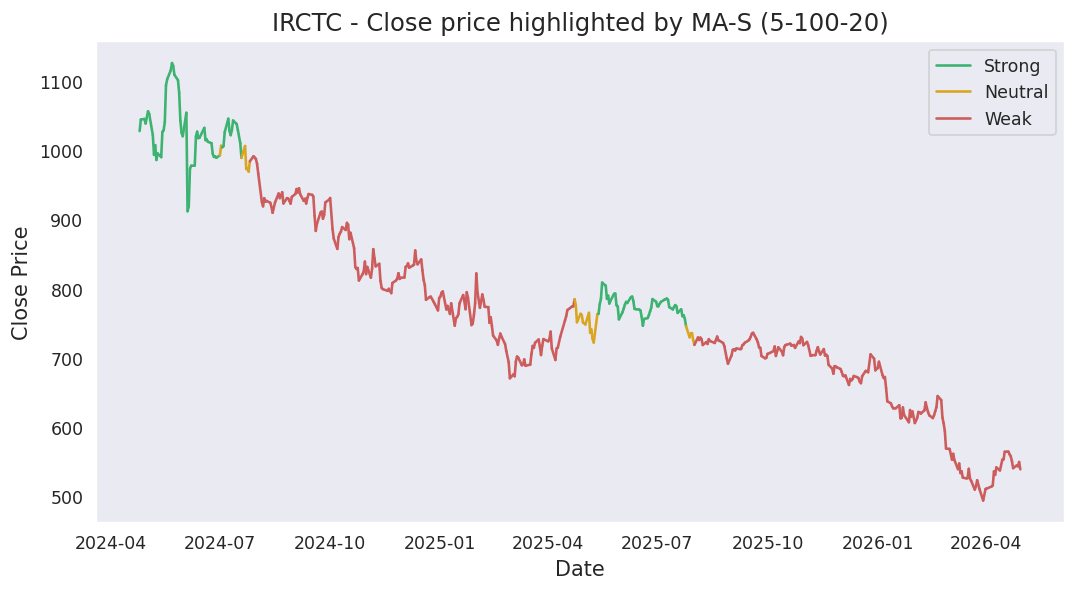
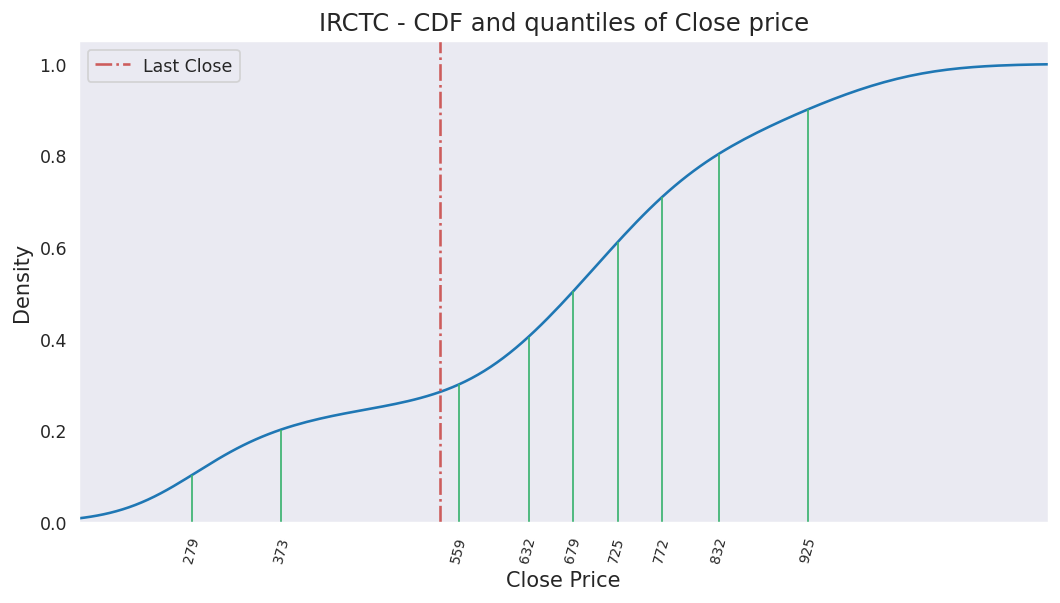
Last close price: 519.6
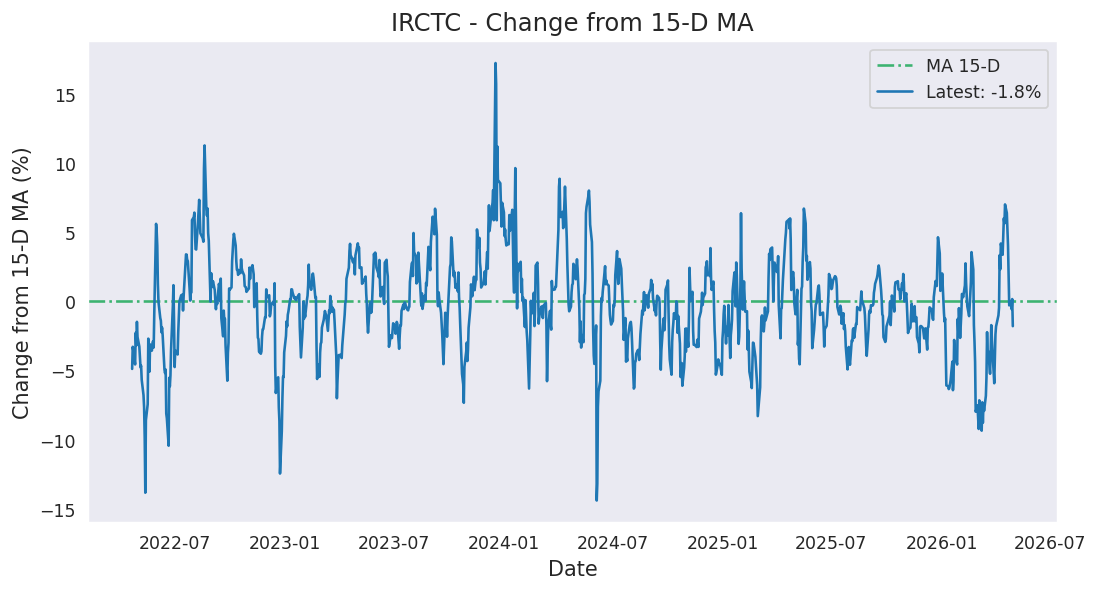
Average of last 15 days: 519.30
Average of last 50 days: 537.07
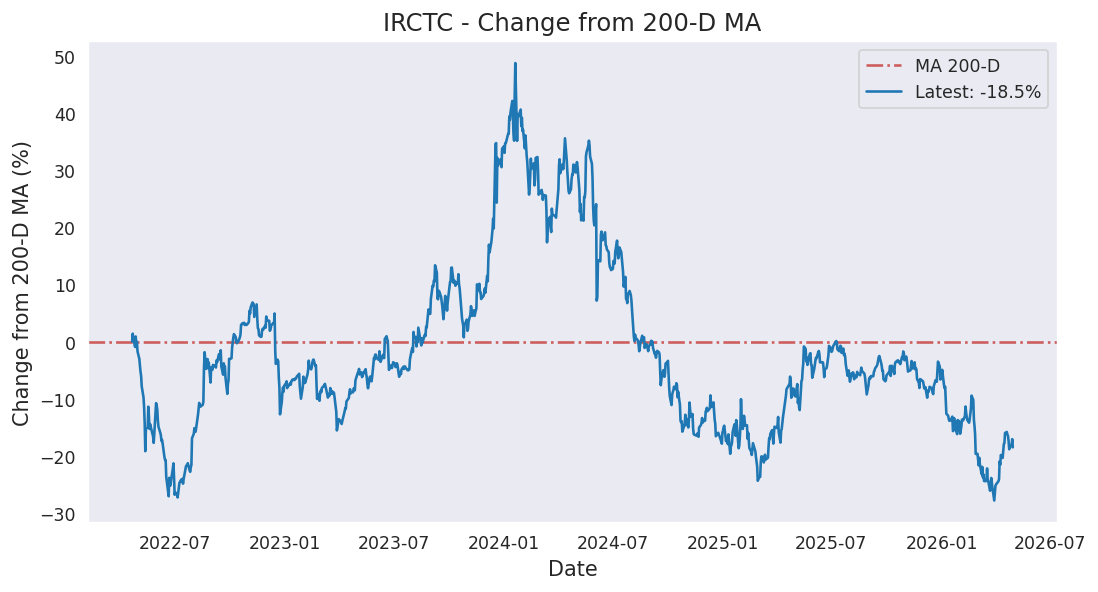
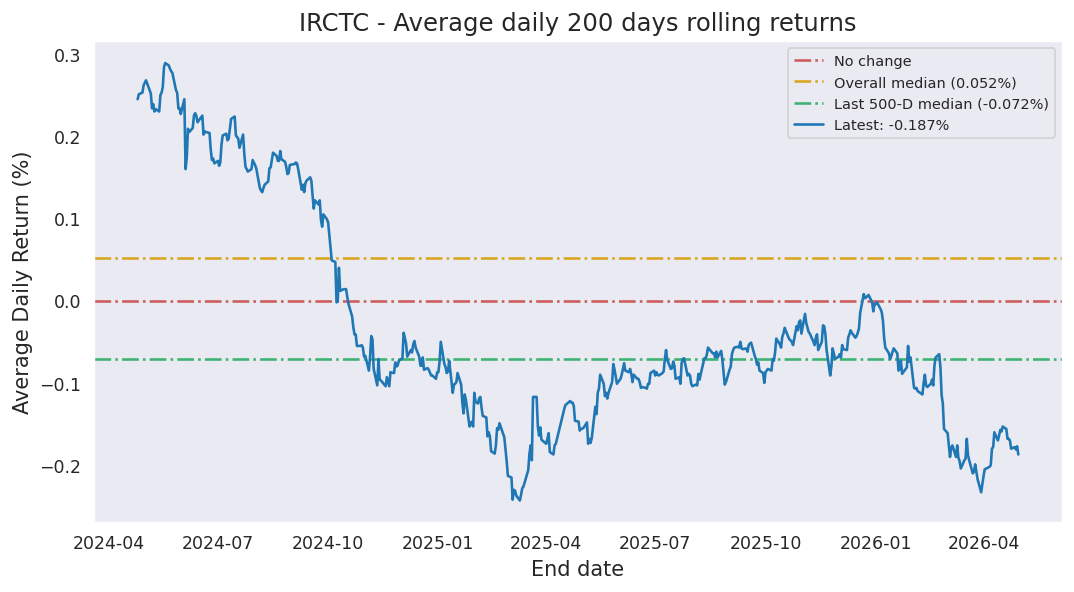
Average of last 200 days: 626.14
Analysis based on 1606 records from January 01, 2020 to June 19, 2026
Last updated on June 19, 2026
| 5 Days | 15 Days | 50 Days | 200 Days | 1000 Days | |
|---|---|---|---|---|---|
| Start Date | June 15, 2026 | June 01, 2026 | April 08, 2026 | August 28, 2025 | June 08, 2022 |
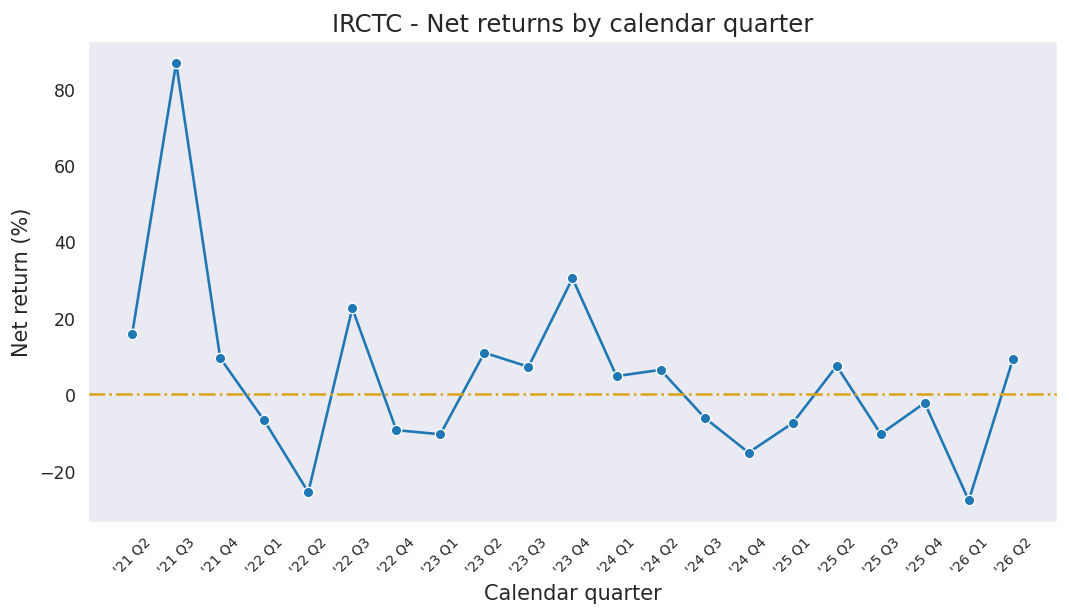
| Net Return | -0.34% | 1.91% | 0.66% | -27.56% | -20.64% |
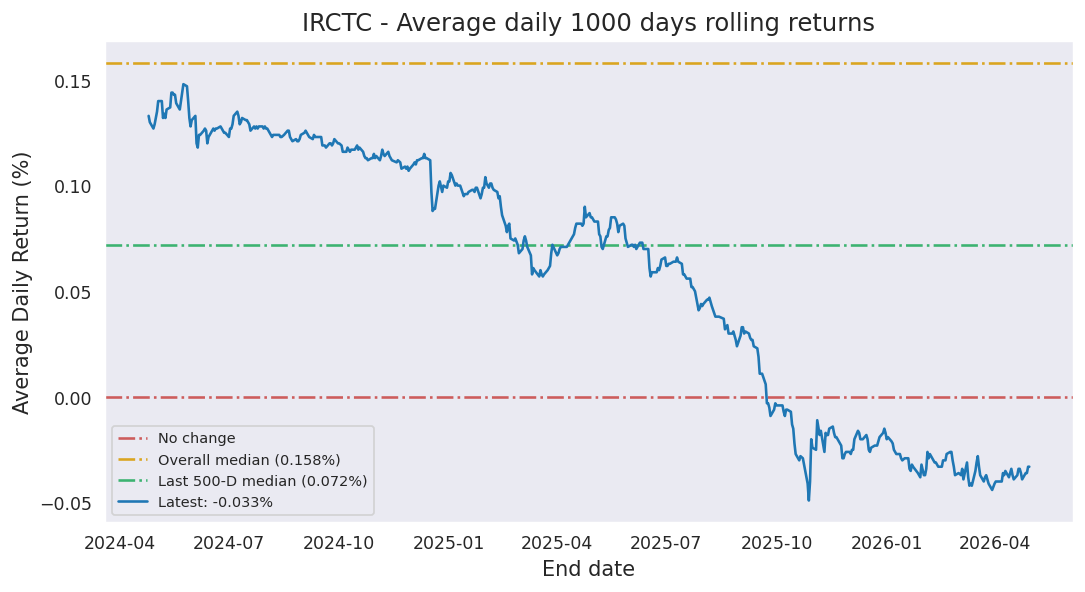
| Average Daily Return | -0.067% | 0.126% | 0.013% | -0.161% | -0.023% |
| Median Close Price | 519.95 | 519.60 | 536.03 | 628.98 | 714.92 |
| Lowest Close Price | 517.95 | 510.80 | 509.85 | 494.50 | 494.50 |
| Highest Close Price | 524.00 | 528.60 | 572.75 | 736.60 | 1126.00 |
| Mean Value Traded | 496.54M | 468.67M | 641.22M | 860.09M | 1.67B |
Last close price: 519.6
Average of last 15 days: 519.30
Average of last 50 days: 537.07
Average of last 200 days: 626.14
IRCTC first closed above its last close price on Monday, August 09, 2021 which was 1775 days ago.
Since then, it has closed over this price 98.4% of times which is 1187 trading days.
Previously, IRCTC closed above its last close price on Thursday, June 18, 2026 which was 1 days ago.
Historically, this stock gave a non-positive return for a maximum period of 1775 days which was from August 09, 2021 to June 19, 2026.
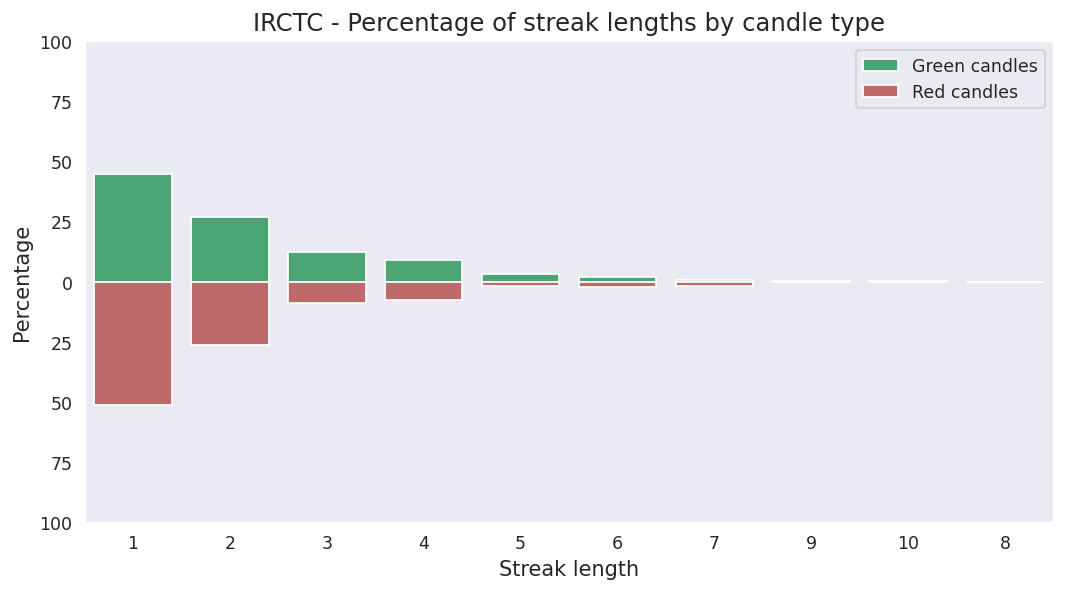
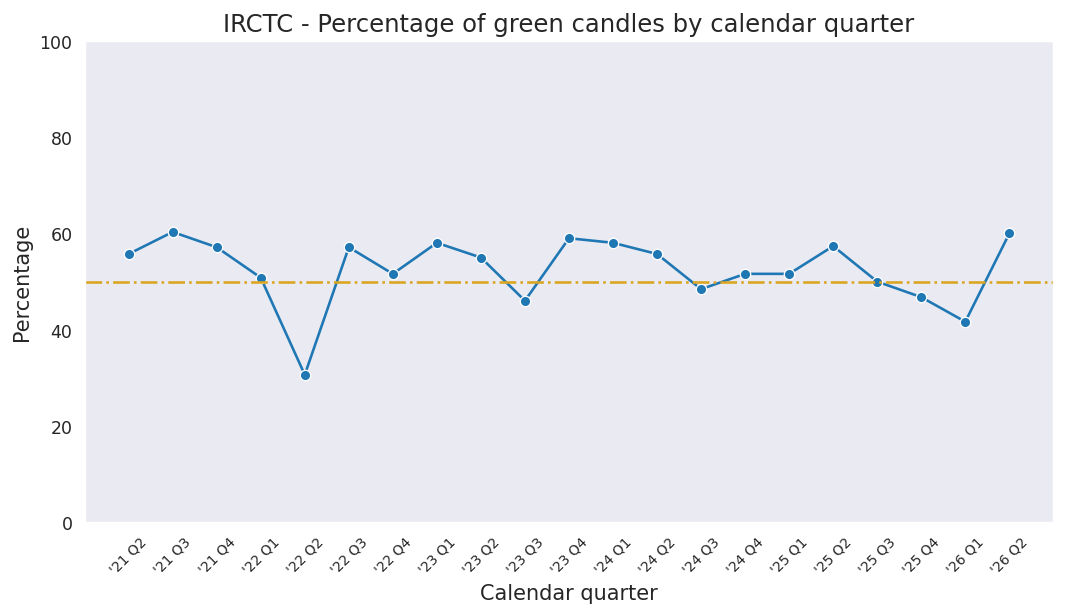
Last candle: Red (-0.84%)
Overall percentage of Red candles: 48.4%
Current streak of Red candles: 1
Net change so far for the current streak: -0.84%
Probability of streak continuing: 48.3%
Longest streak of Red candles: 9 trading days from April 29, 2022 to May 12, 2022
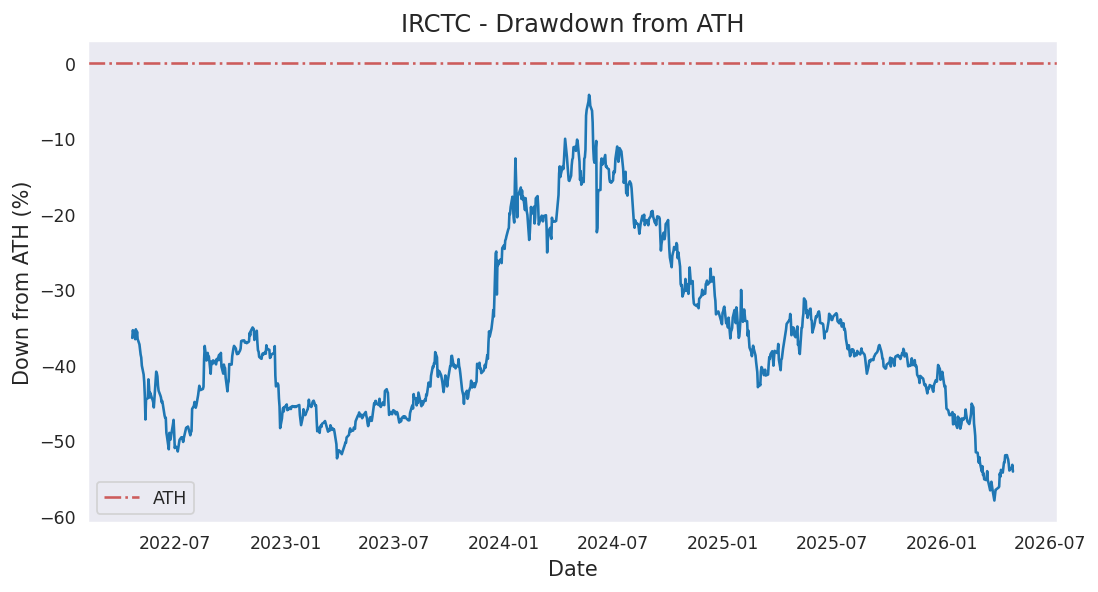
Current down from ATH: -55.80%
Most down from ATH: -58.23%
ATH hits in last 1000 days: 0
ATH was last hit on Monday, October 18, 2021.