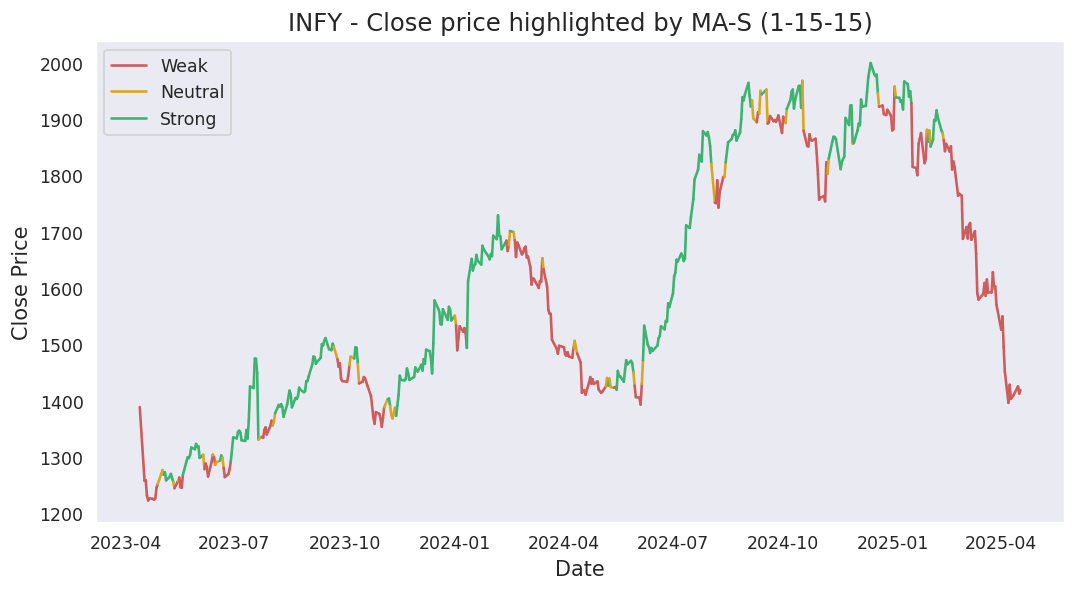
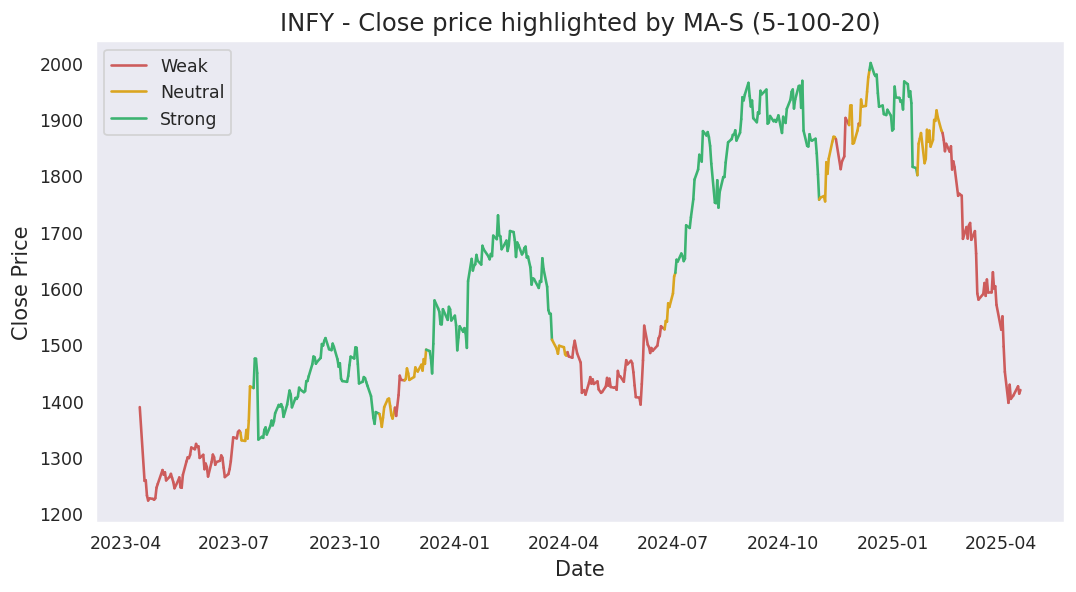
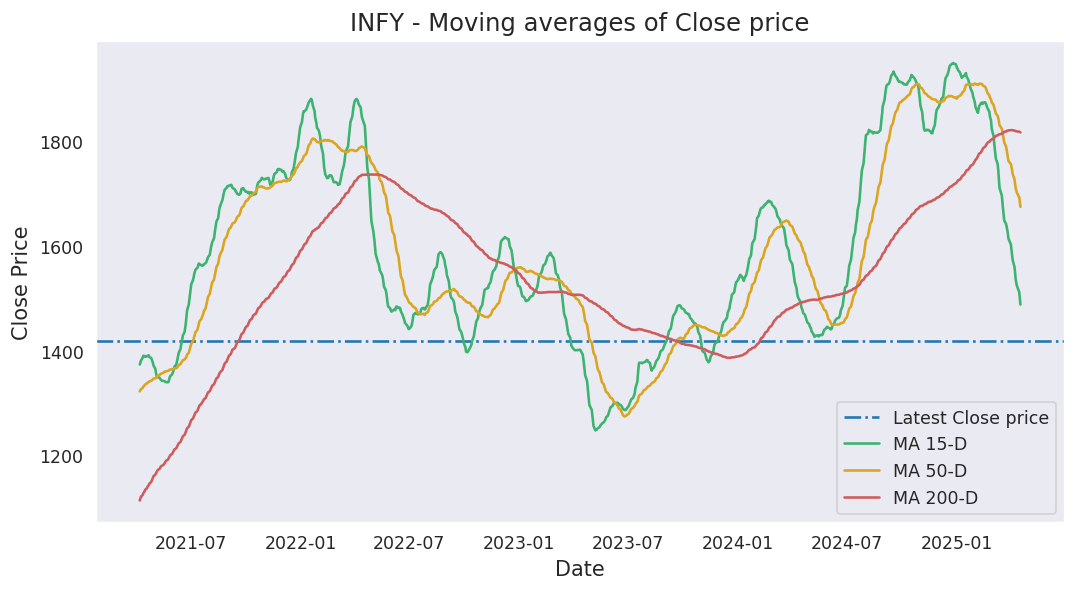
Moving averages
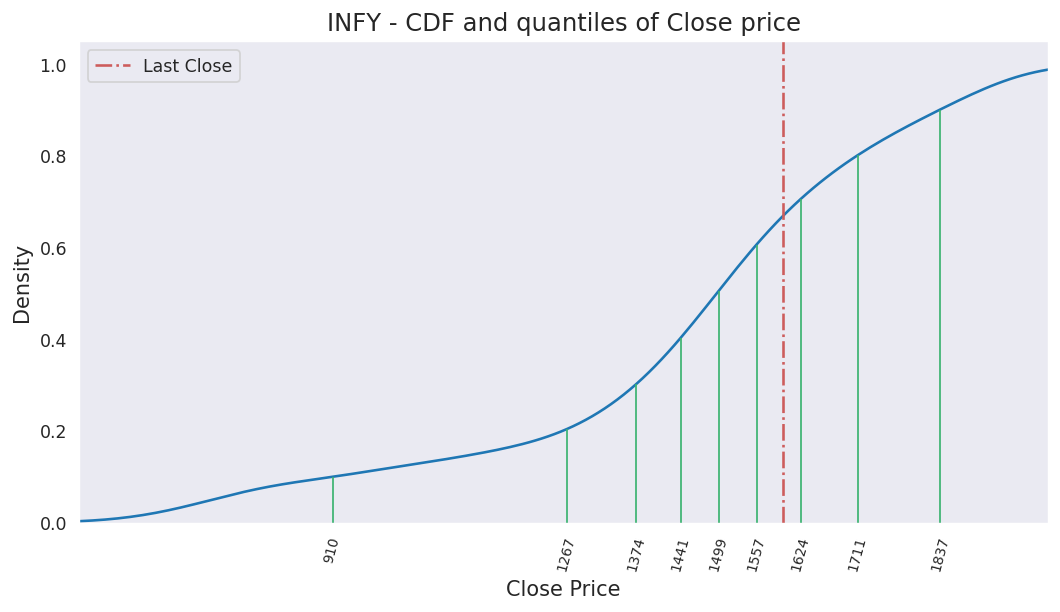
Last close price: 1051.4
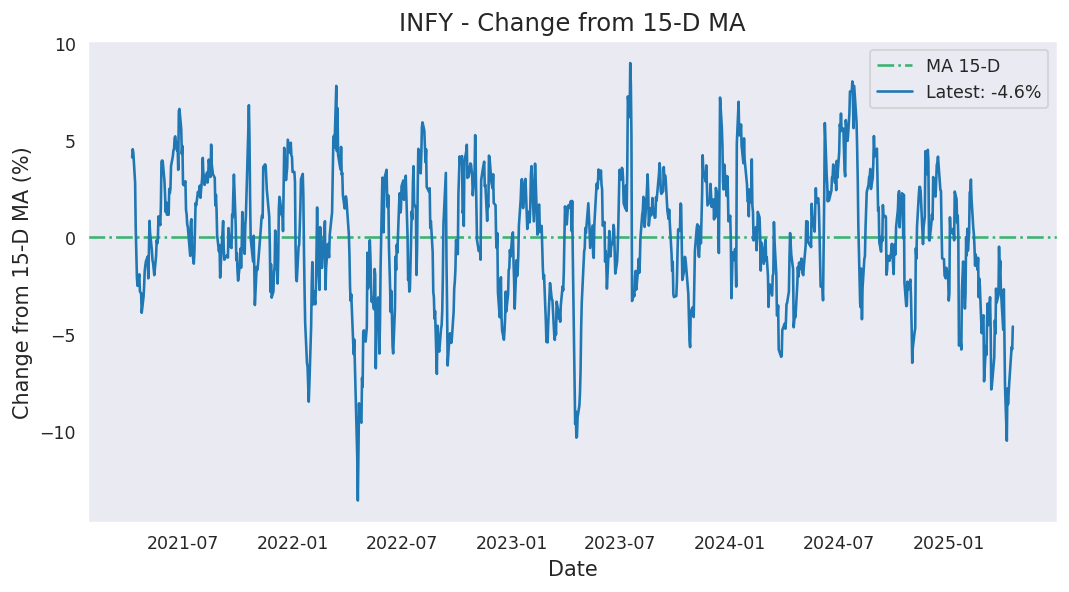
Average of last 15 days: 1163.60
Average of last 50 days: 1193.23
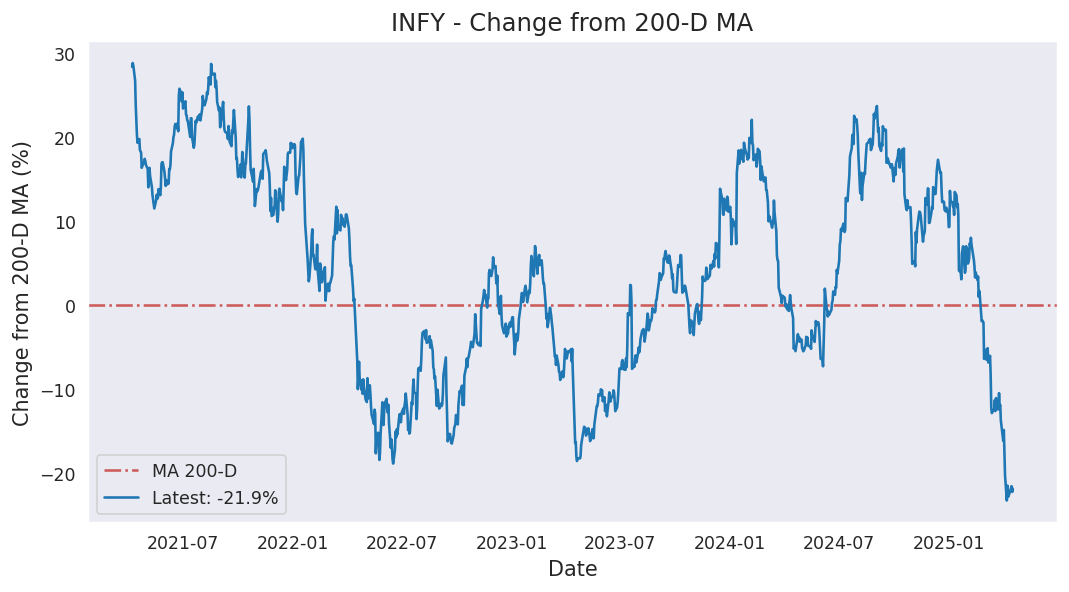
Average of last 200 days: 1416.86
Analysis based on 1606 records from January 01, 2020 to June 19, 2026
Last updated on June 19, 2026
| 5 Days | 15 Days | 50 Days | 200 Days | 1000 Days | |
|---|---|---|---|---|---|
| Start Date | June 15, 2026 | June 01, 2026 | April 08, 2026 | August 28, 2025 | June 08, 2022 |
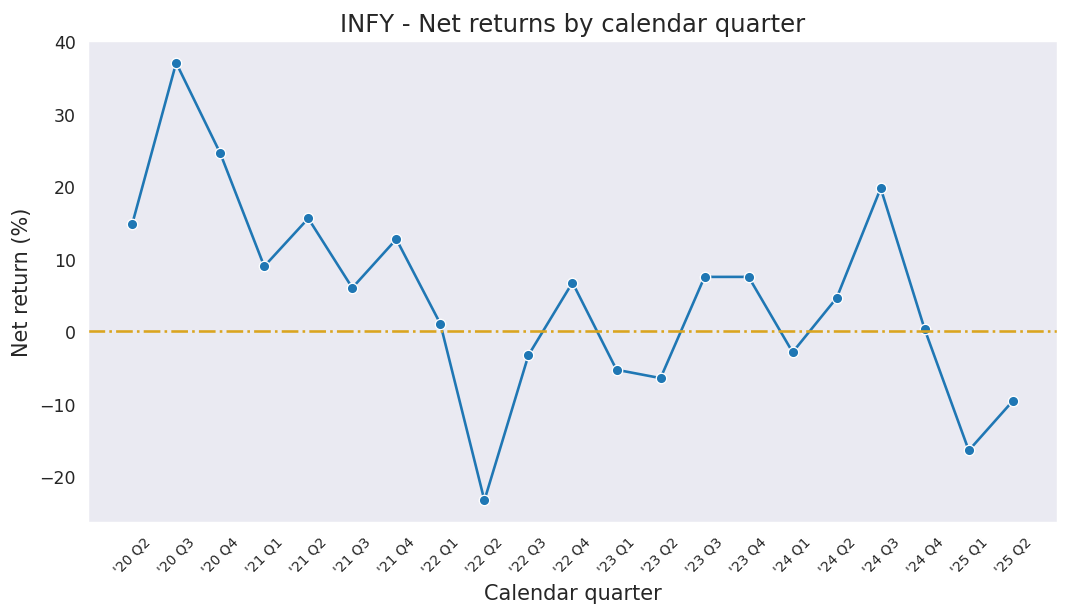
| Net Return | -5.82% | -9.43% | -21.50% | -31.26% | -30.22% |
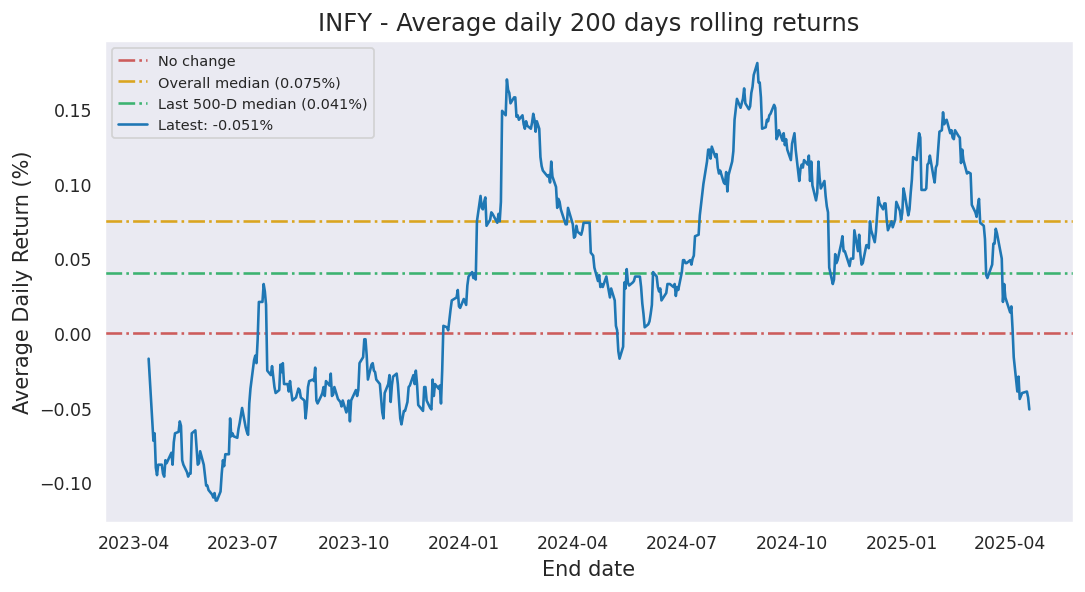
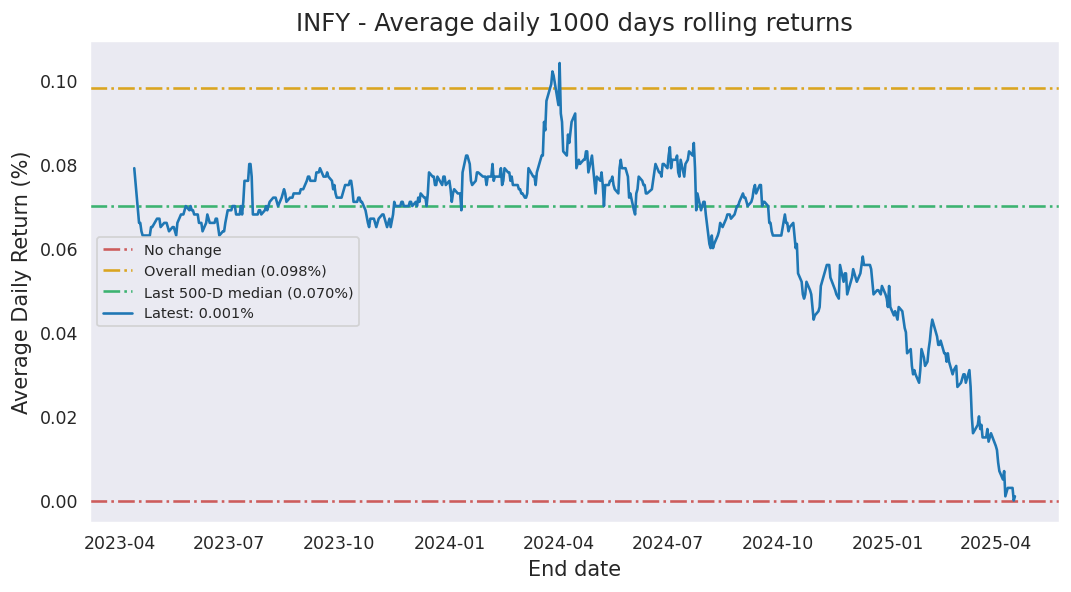
| Average Daily Return | -1.193% | -0.658% | -0.483% | -0.187% | -0.036% |
| Median Close Price | 1134.90 | 1157.70 | 1175.75 | 1471.70 | 1508.92 |
| Lowest Close Price | 1051.40 | 1051.40 | 1051.40 | 1051.40 | 1051.40 |
| Highest Close Price | 1157.70 | 1270.80 | 1346.20 | 1689.80 | 1999.70 |
| Mean Value Traded | 18.89B | 17.65B | 18.03B | 15.17B | 11.35B |
Last close price: 1051.4
Average of last 15 days: 1163.60
Average of last 50 days: 1193.23
Average of last 200 days: 1416.86
INFY first closed above its last close price on Tuesday, October 06, 2020 which was 2082 days ago.
Since then, it has closed over this price 100.0% of times which is 1415 trading days.
Previously, INFY closed above its last close price on Thursday, June 18, 2026 which was 1 days ago.
Historically, this stock gave a non-positive return for a maximum period of 2082 days which was from October 06, 2020 to June 19, 2026.
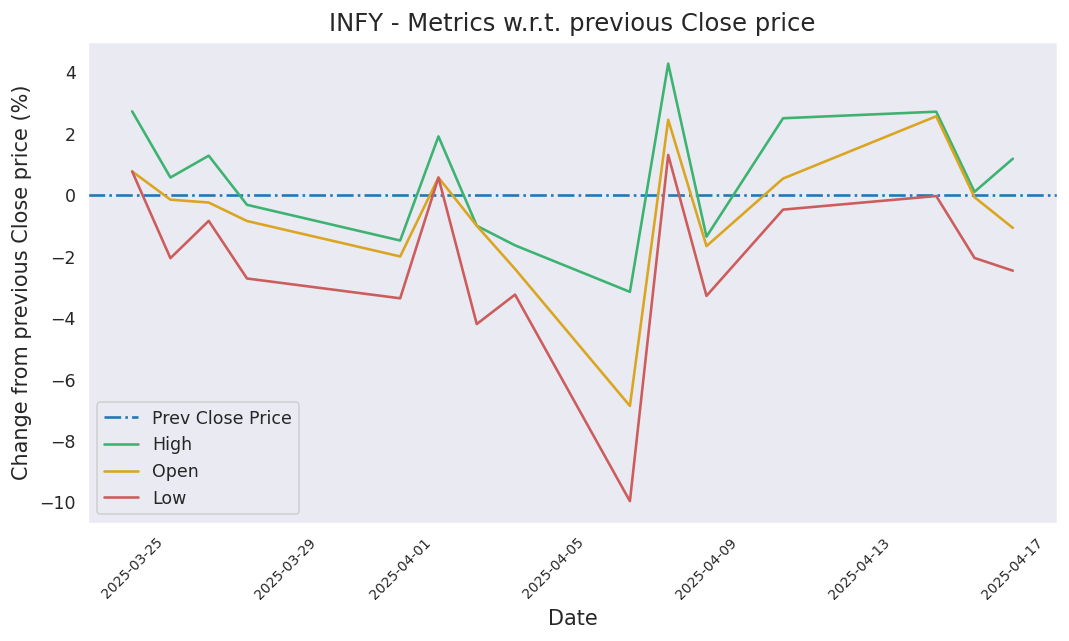
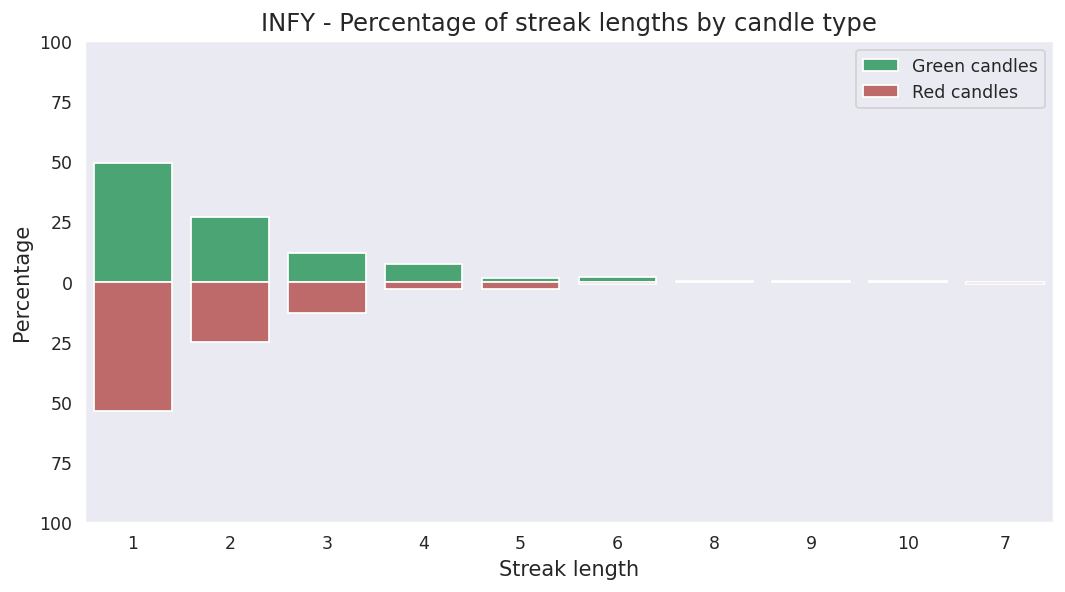
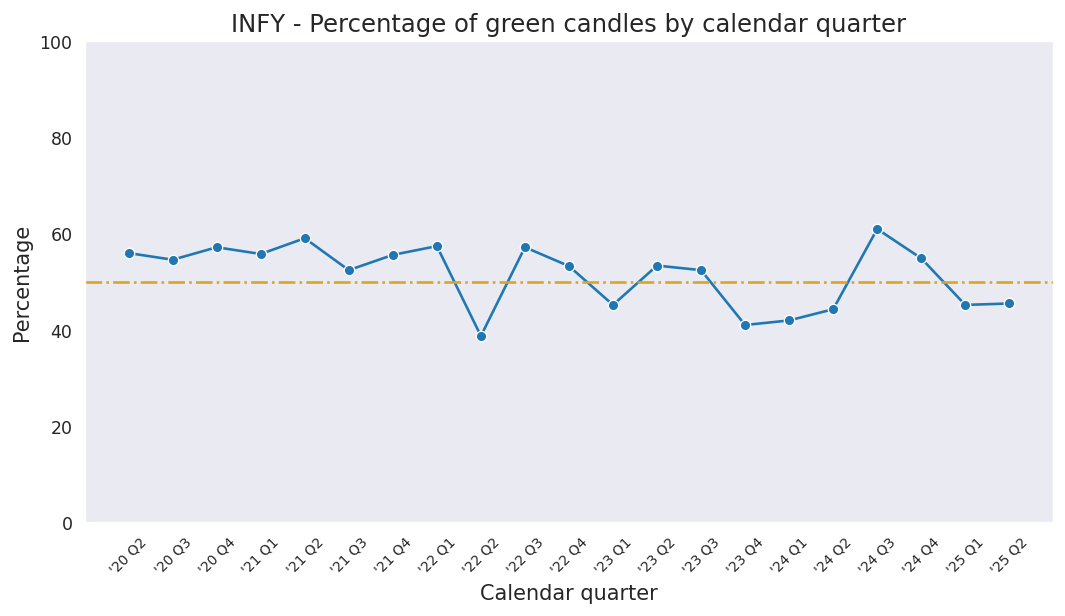
Last candle: Red (-6.75%)
Overall percentage of Red candles: 49.0%
Current streak of Red candles: 2
Net change so far for the current streak: -9.18%
Probability of streak continuing: 47.4%
Longest streak of Red candles: 8 trading days from March 15, 2024 to March 27, 2024
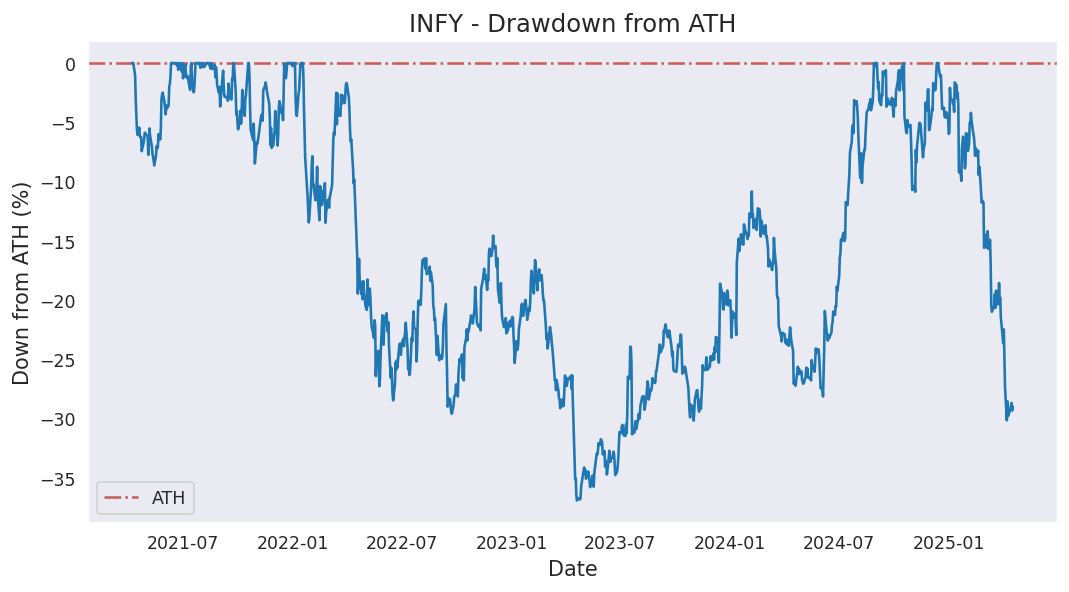
Current down from ATH: -47.42%
Most down from ATH: -47.42%
ATH hits in last 1000 days: 6
ATH was last hit on Friday, December 13, 2024.