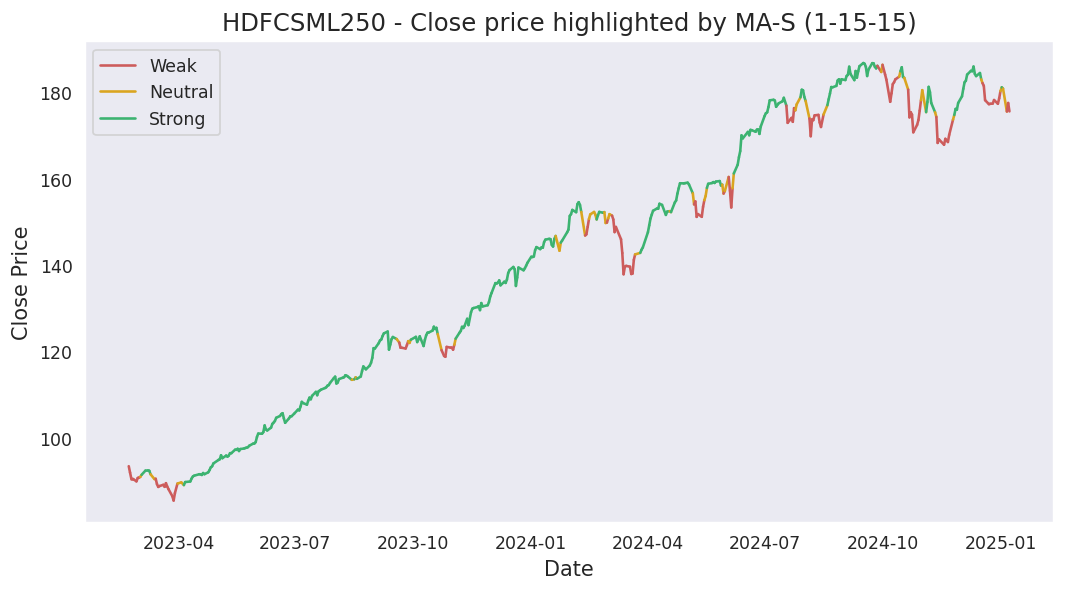
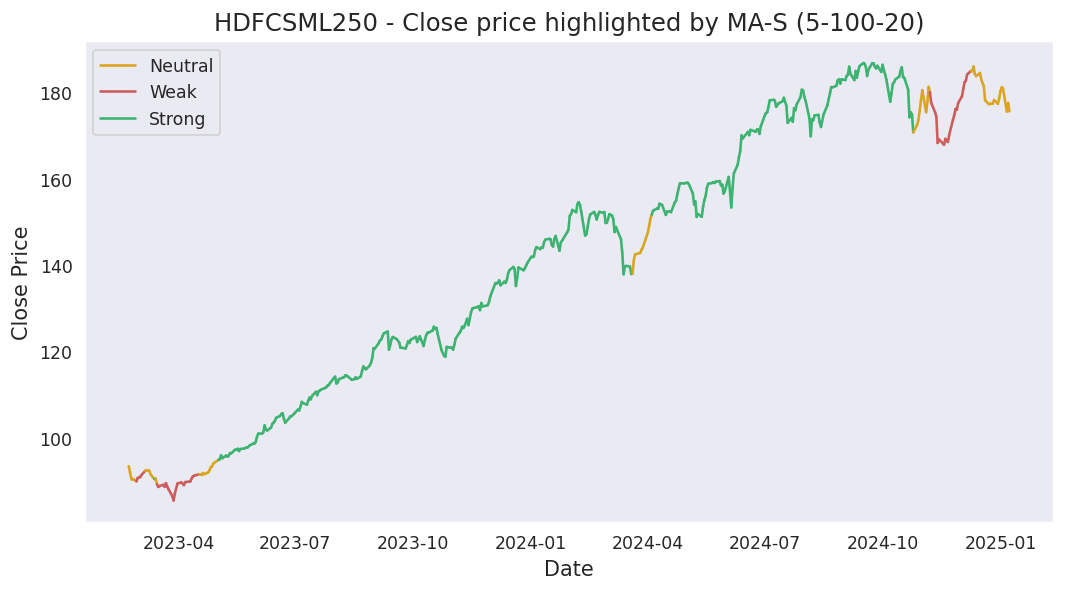
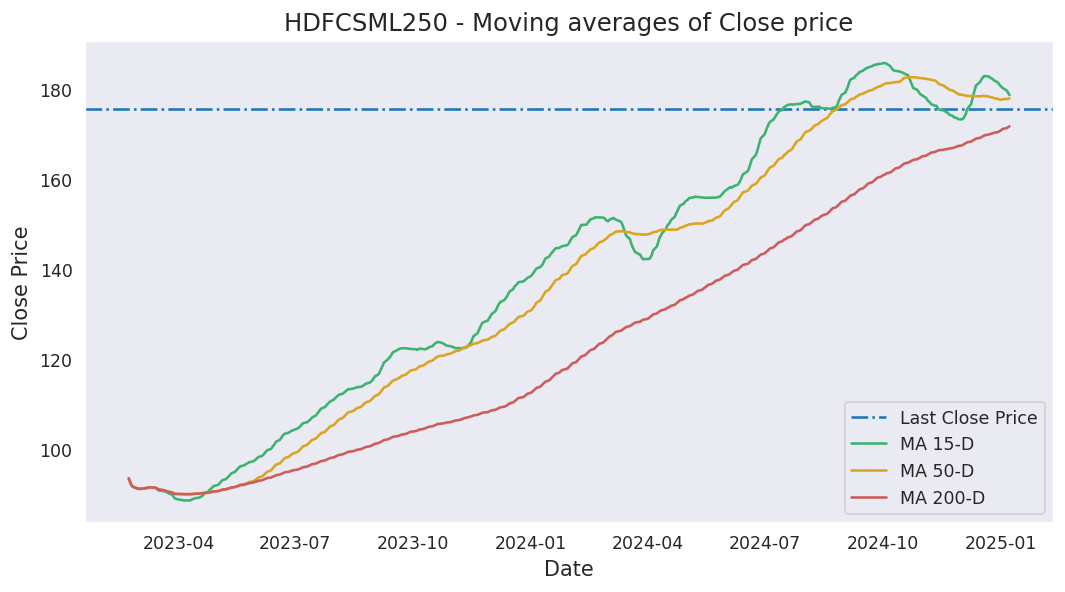
Moving averages
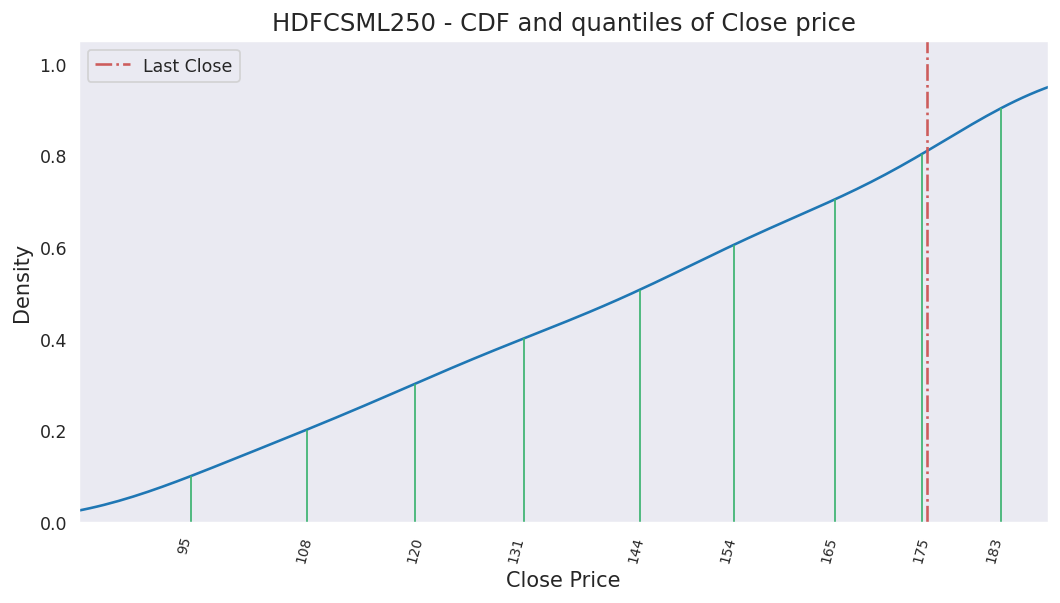
Last close price: 178.63
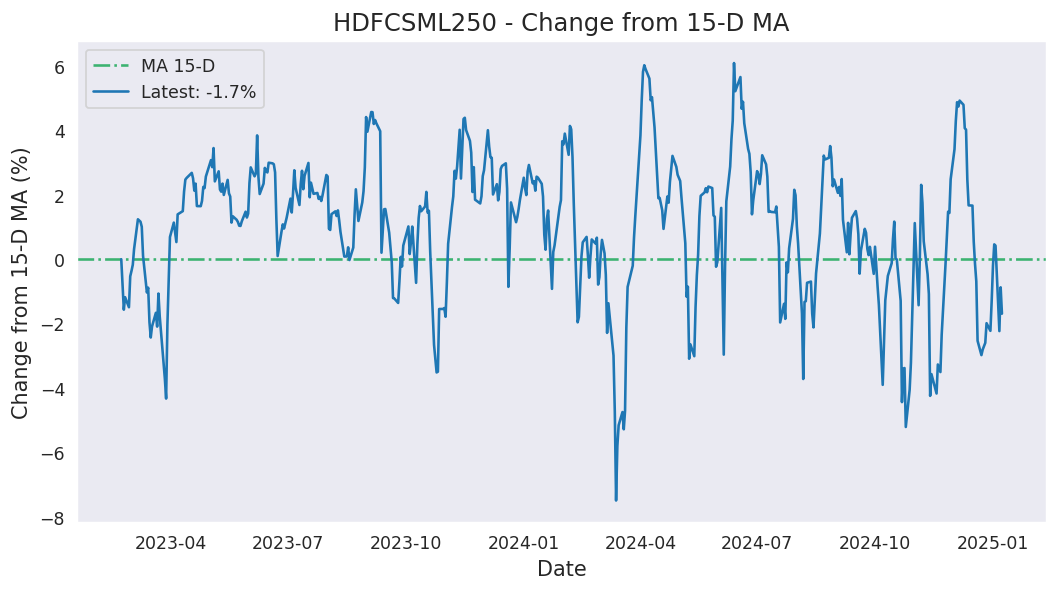
Average of last 15 days: 172.22
Average of last 50 days: 168.86
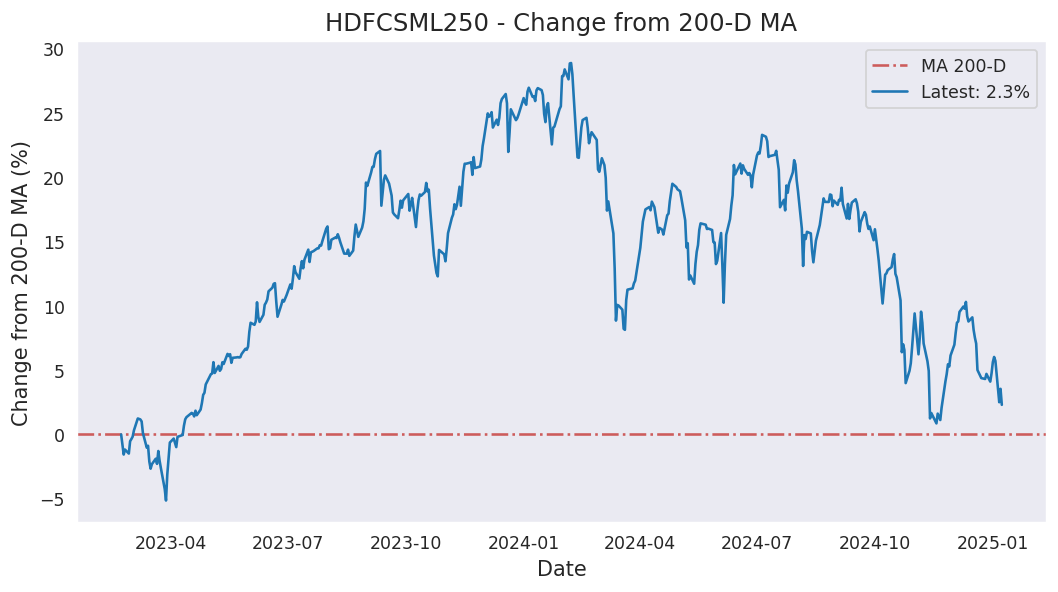
Average of last 200 days: 165.86
Analysis based on 823 records from February 21, 2023 to June 19, 2026
Last updated on June 19, 2026
| 5 Days | 15 Days | 50 Days | 200 Days | 823 Days | |
|---|---|---|---|---|---|
| Start Date | June 15, 2026 | June 01, 2026 | April 08, 2026 | August 28, 2025 | February 21, 2023 |
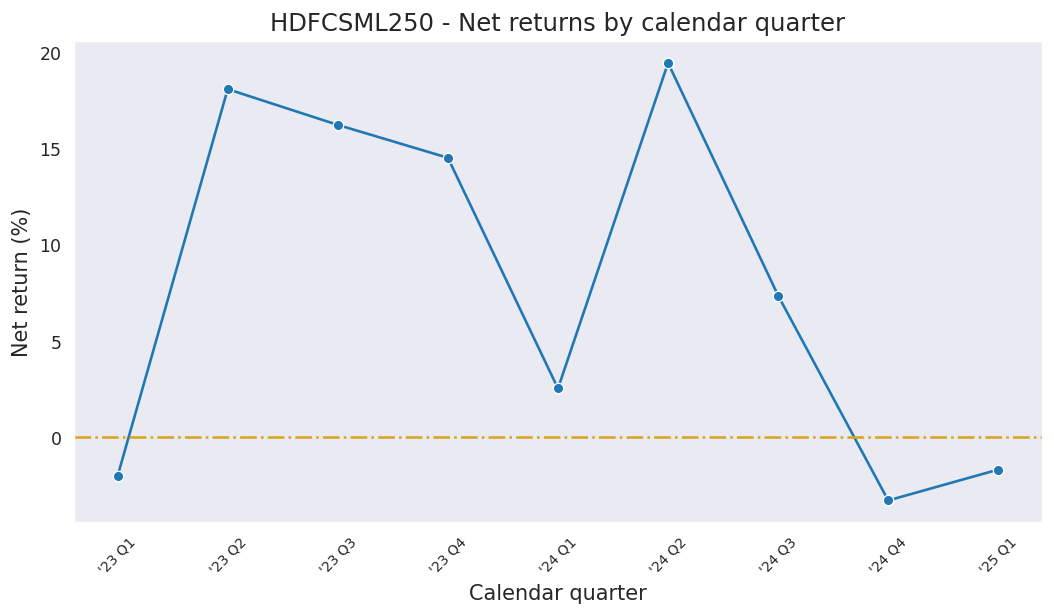
| Net Return | 3.73% | 4.67% | 18.84% | 5.84% | 95.63% |
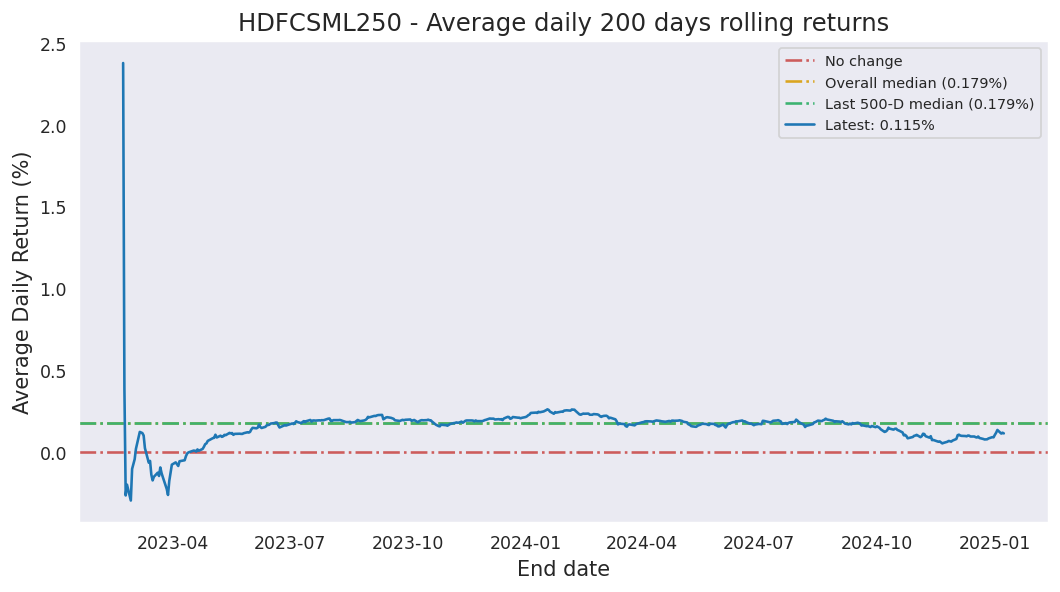
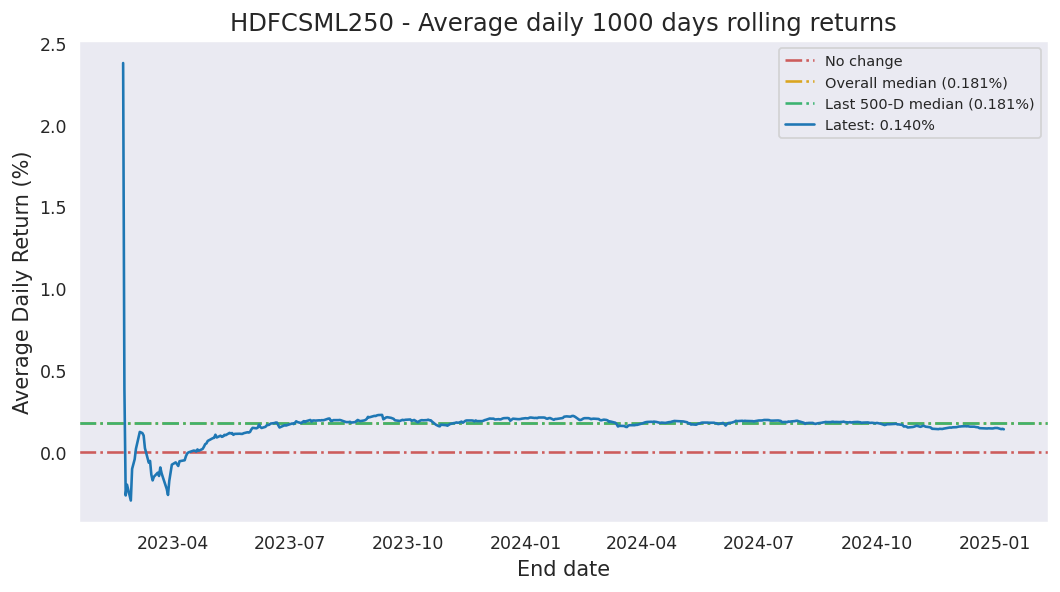
| Average Daily Return | 0.736% | 0.305% | 0.346% | 0.028% | 0.082% |
| Median Close Price | 176.38 | 171.22 | 168.89 | 168.06 | 159.04 |
| Lowest Close Price | 174.24 | 167.52 | 156.07 | 143.66 | 85.53 |
| Highest Close Price | 178.63 | 178.63 | 178.63 | 178.63 | 186.83 |
| Mean Value Traded | 301.71M | 327.91M | 373.45M | 301.04M | 134.30M |
Last close price: 178.63
Average of last 15 days: 172.22
Average of last 50 days: 168.86
Average of last 200 days: 165.86
HDFCSML250 first closed above its last close price on Tuesday, July 16, 2024 which was 703 days ago.
Since then, it has closed over this price 16.7% of times which is 80 trading days.
Previously, HDFCSML250 closed above its last close price on Wednesday, July 23, 2025 which was 331 days ago.
Historically, this stock gave a non-positive return for a maximum period of 815 days which was from January 05, 2024 to March 30, 2026.
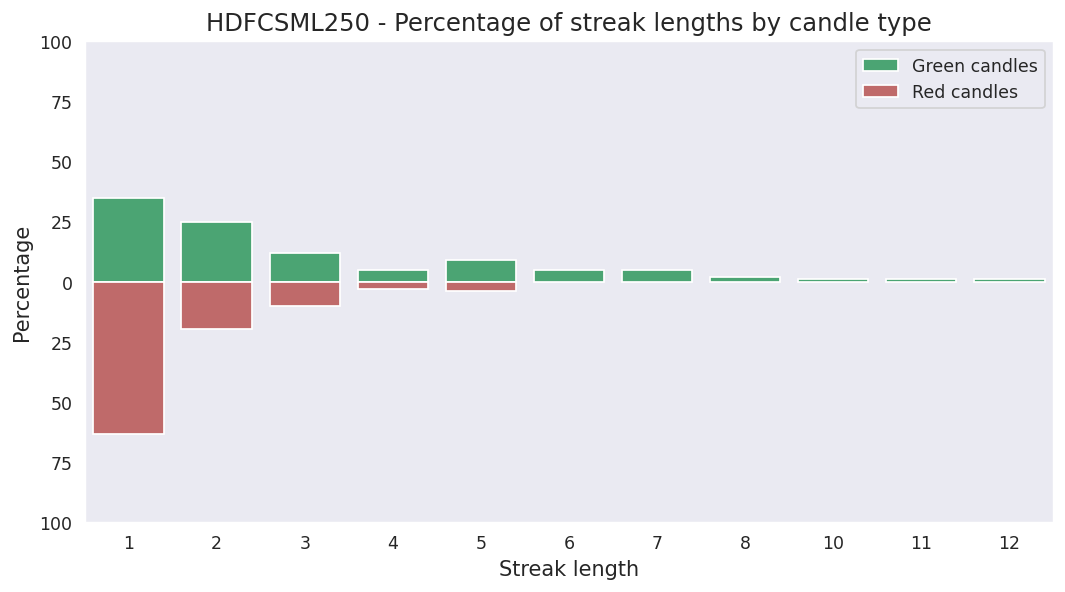
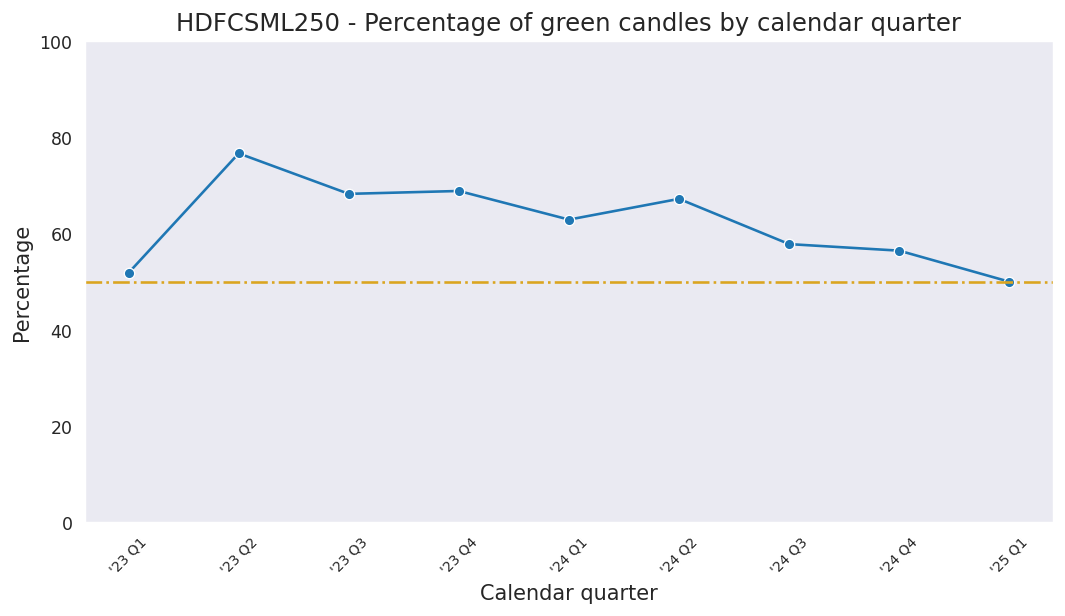
Last candle: Green (0.65%)
Overall percentage of Green candles: 58.6%
Current streak of Green candles: 6
Net change so far for the current streak: 6.63%
Probability of streak continuing: 63.6%
Longest streak of Green candles: 13 trading days from May 23, 2025 to June 10, 2025
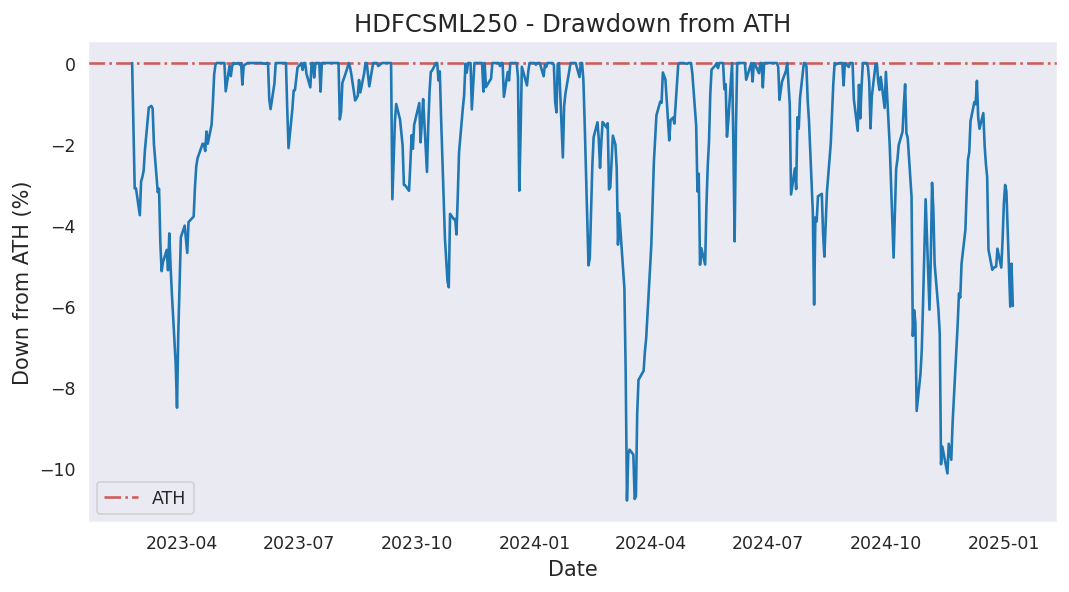
Current down from ATH: -4.39%
Most down from ATH: -25.90%
ATH hits in last 1000 days: 133
ATH was last hit on Monday, September 16, 2024.