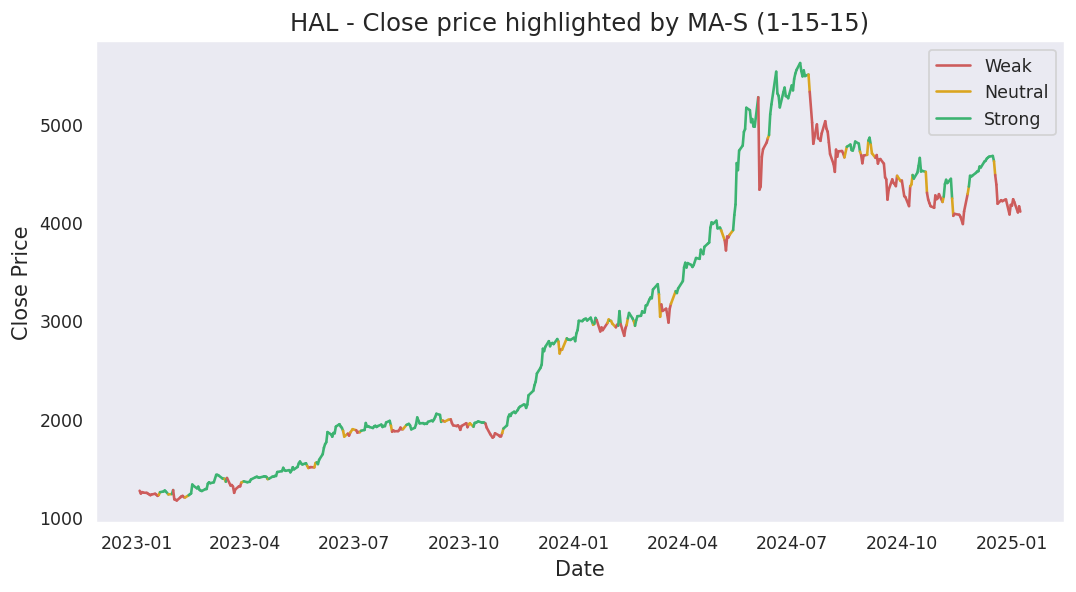
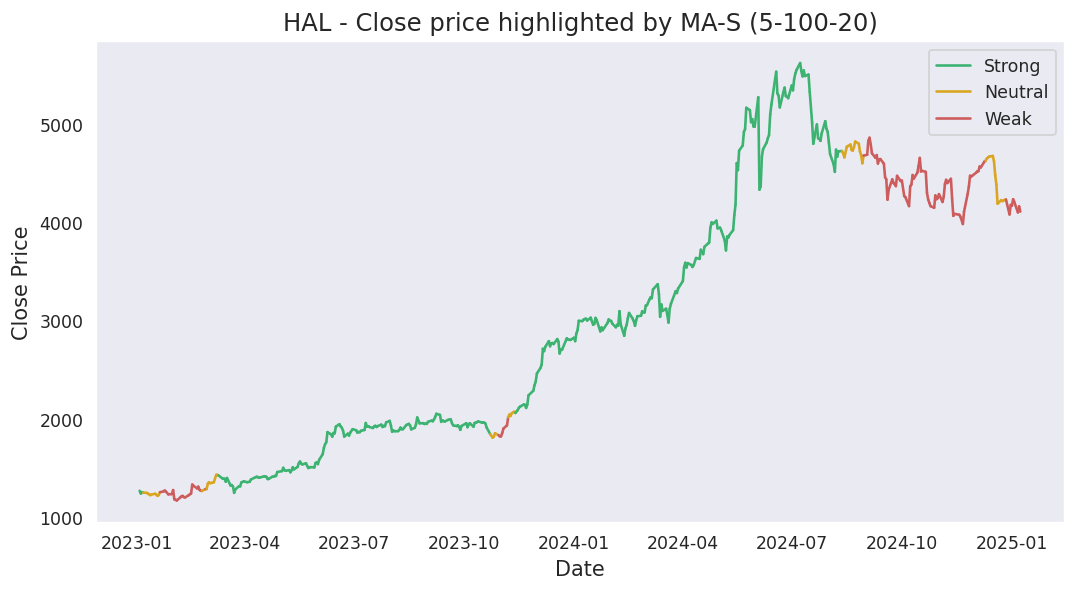
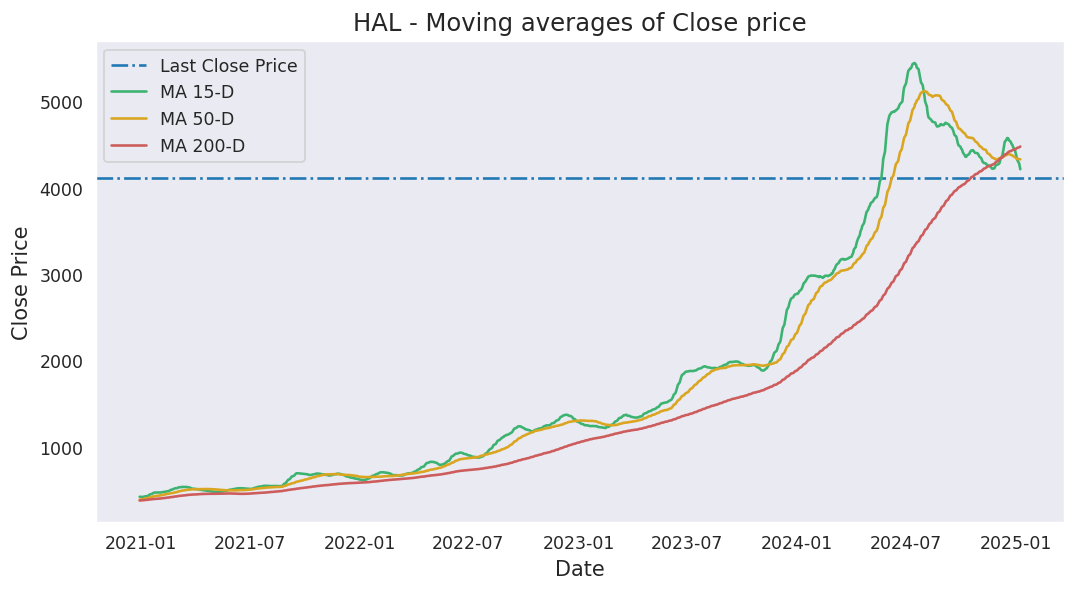
Moving averages
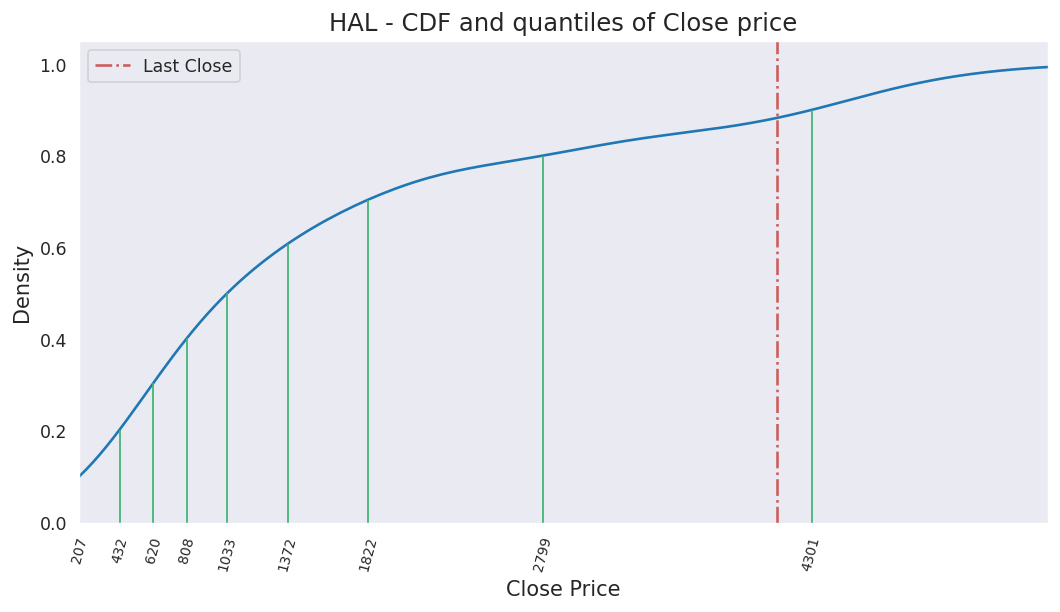
Last close price: 4408.1
Average of last 15 days: 4274.05
Average of last 50 days: 4358.44
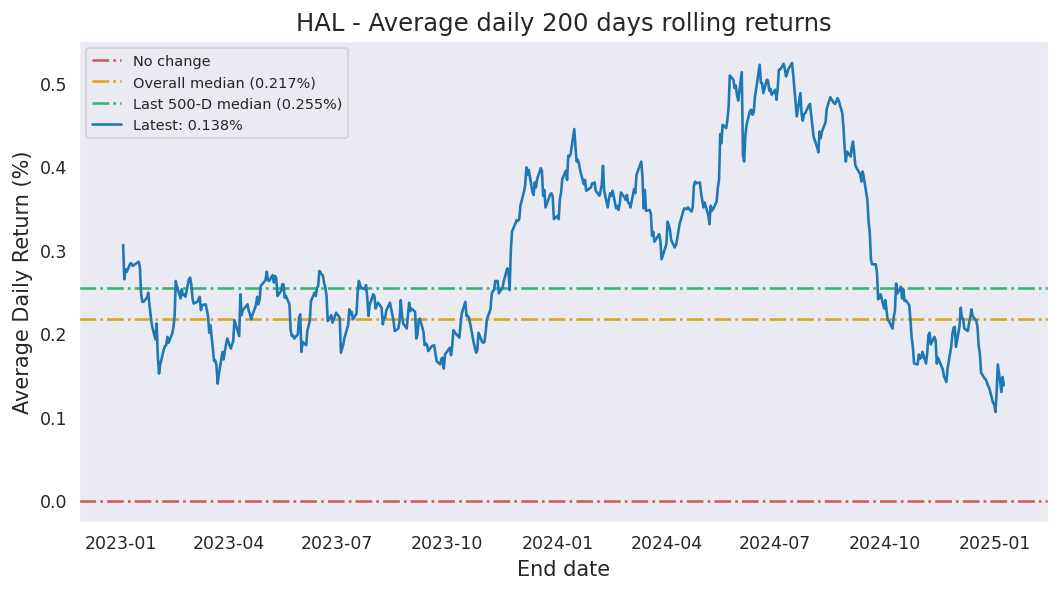
Average of last 200 days: 4394.83
Analysis based on 1606 records from January 01, 2020 to June 19, 2026
Last updated on June 19, 2026
| 5 Days | 15 Days | 50 Days | 200 Days | 1000 Days | |
|---|---|---|---|---|---|
| Start Date | June 15, 2026 | June 01, 2026 | April 08, 2026 | August 28, 2025 | June 08, 2022 |
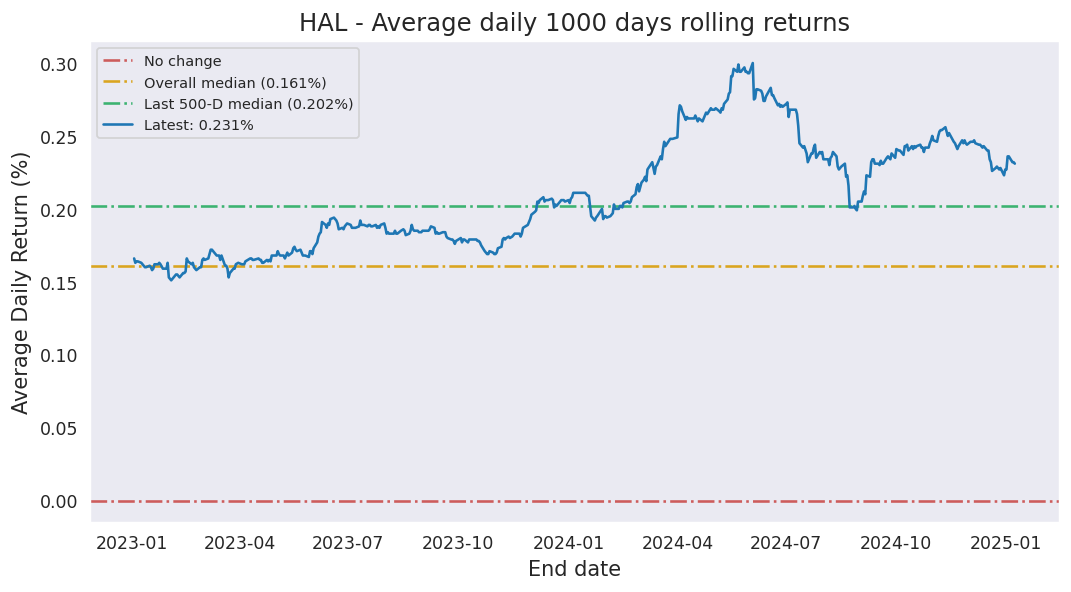
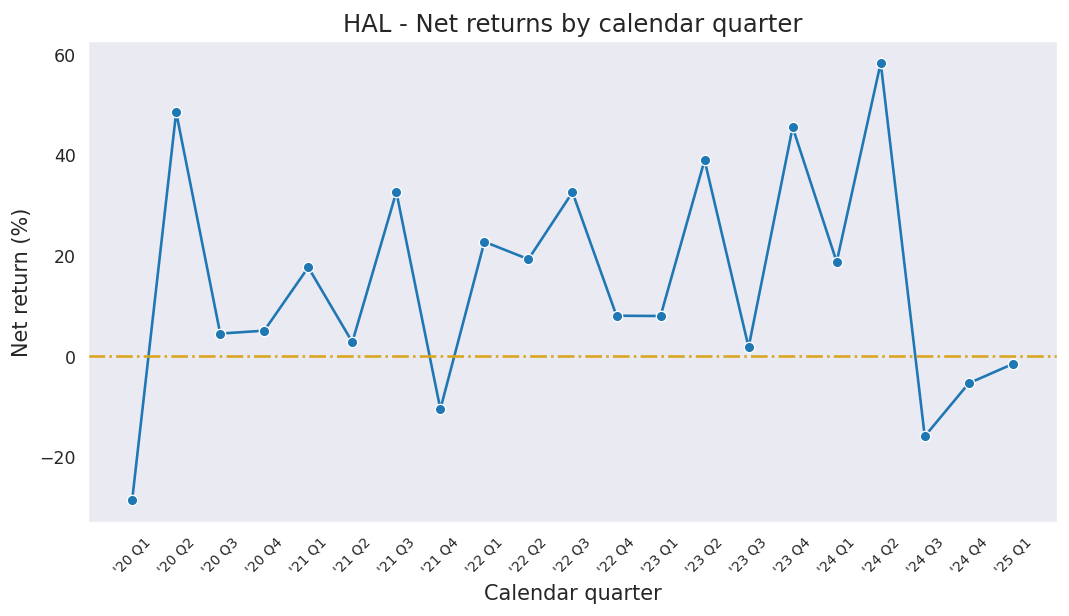
| Net Return | 5.15% | 2.42% | 16.12% | 0.56% | 364.35% |
| Average Daily Return | 1.009% | 0.160% | 0.299% | 0.003% | 0.154% |
| Median Close Price | 4408.10 | 4255.80 | 4342.95 | 4402.70 | 3745.98 |
| Lowest Close Price | 4255.80 | 4172.30 | 3907.50 | 3487.20 | 862.05 |
| Highest Close Price | 4460.50 | 4460.50 | 4788.10 | 4916.20 | 5621.95 |
| Mean Value Traded | 4.13B | 3.52B | 5.42B | 5.53B | 6.35B |
Last close price: 4408.1
Average of last 15 days: 4274.05
Average of last 50 days: 4358.44
Average of last 200 days: 4394.83
HAL first closed above its last close price on Thursday, May 16, 2024 which was 764 days ago.
Since then, it has closed over this price 57.1% of times which is 297 trading days.
Previously, HAL closed above its last close price on Thursday, June 18, 2026 which was 1 days ago.
Historically, this stock gave a non-positive return for a maximum period of 764 days which was from May 16, 2024 to June 19, 2026.
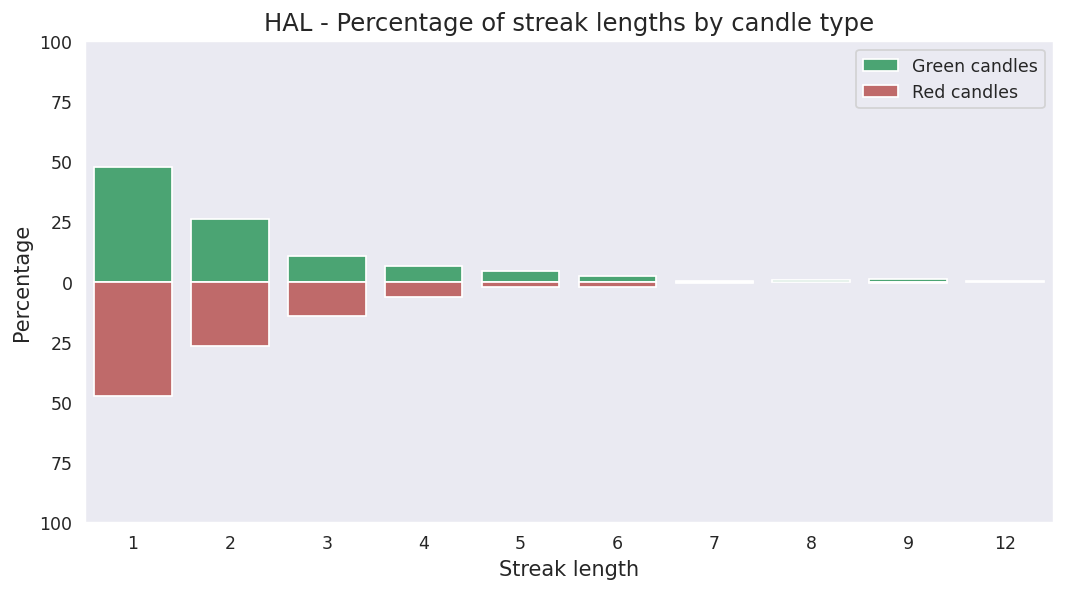
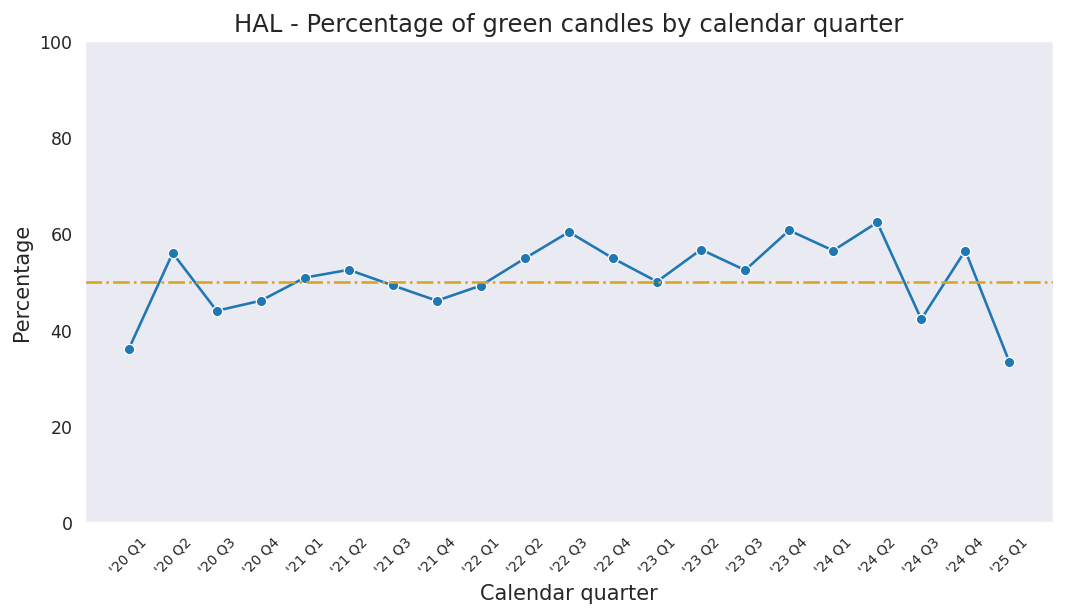
Last candle: Red (-0.08%)
Overall percentage of Red candles: 48.4%
Current streak of Red candles: 2
Net change so far for the current streak: -1.17%
Probability of streak continuing: 47.8%
Longest streak of Red candles: 9 trading days from January 22, 2020 to February 01, 2020
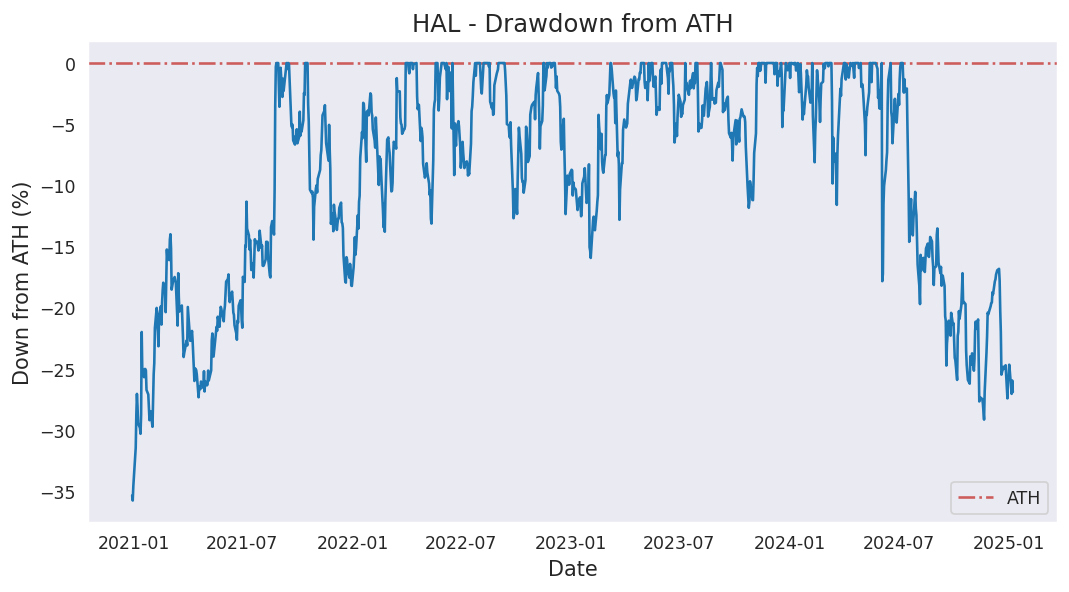
Current down from ATH: -21.59%
Most down from ATH: -48.91%
ATH hits in last 1000 days: 105
ATH was last hit on Monday, July 08, 2024.