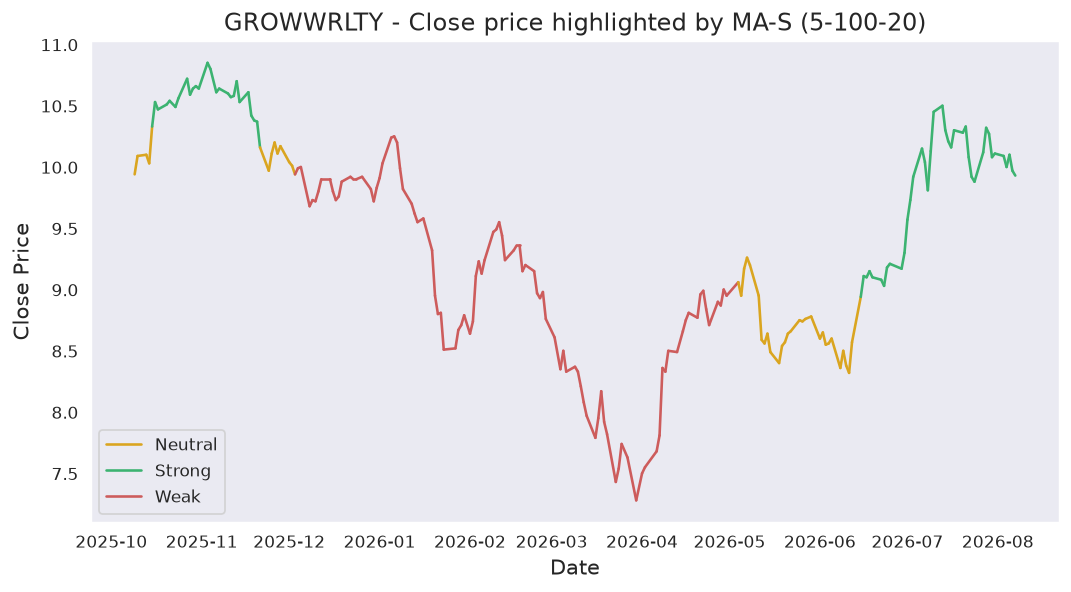
Moving averages
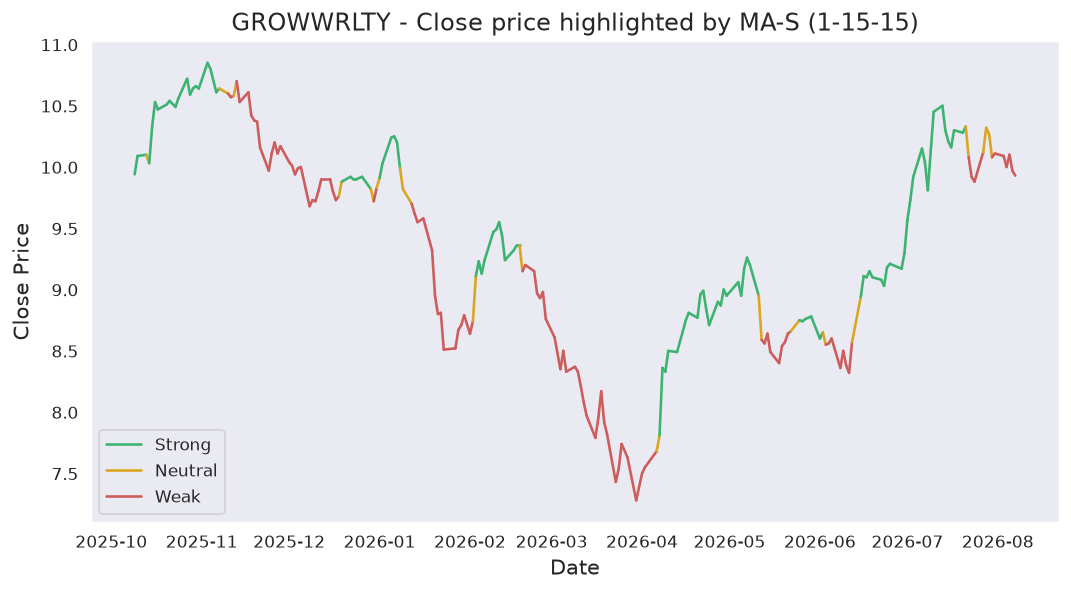
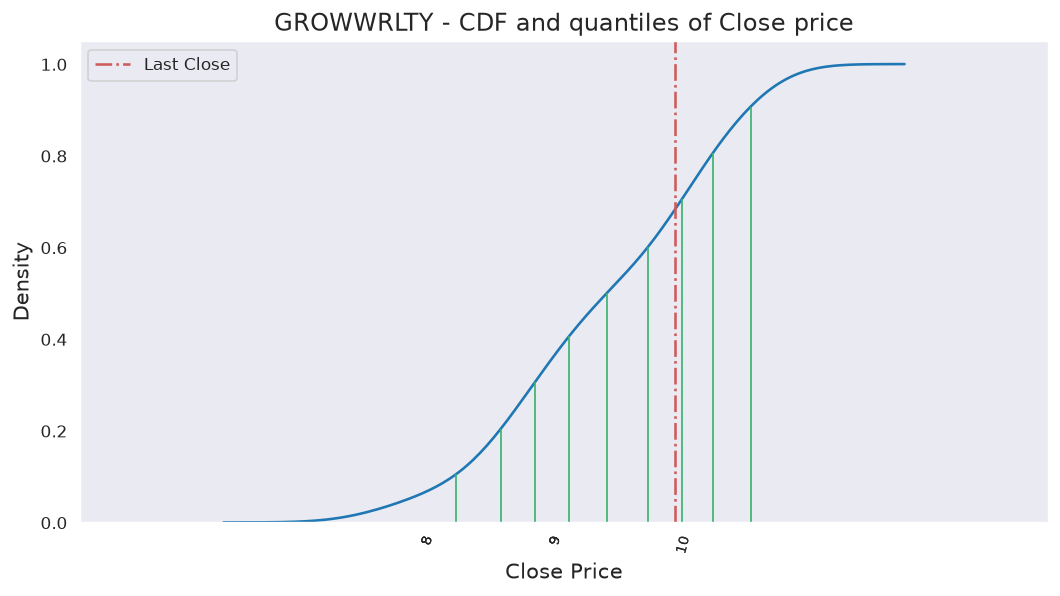
Last close price: 9.37
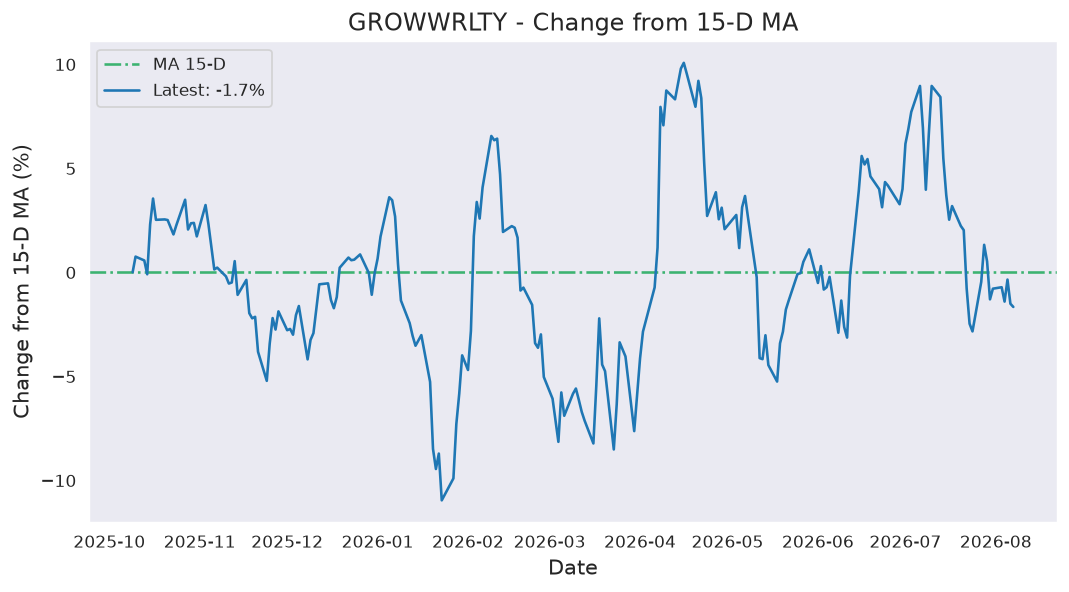
Average of last 15 days: 9.51
Average of last 50 days: 9.91
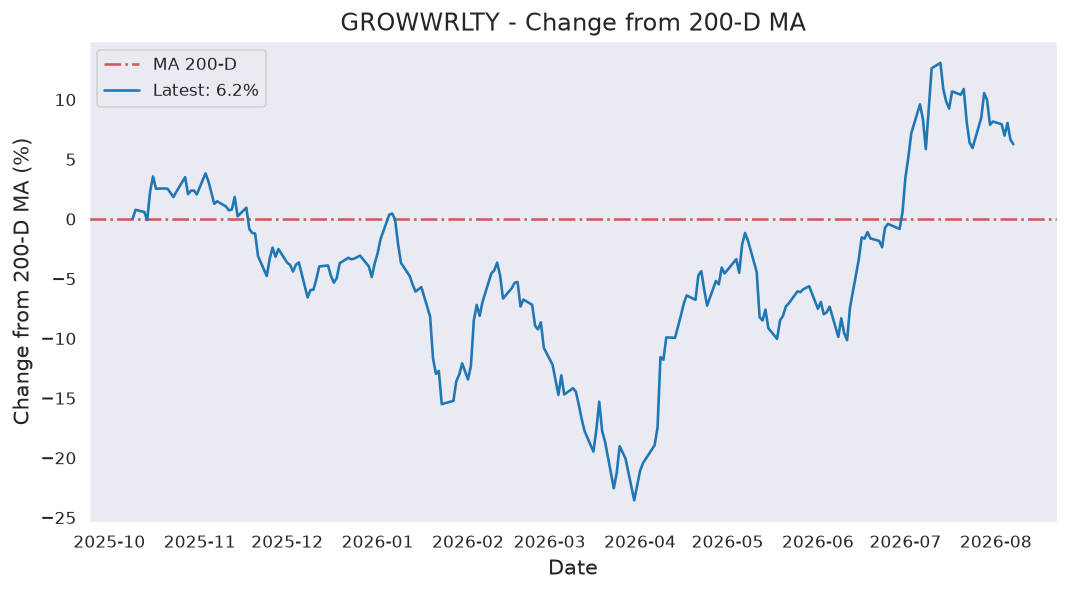
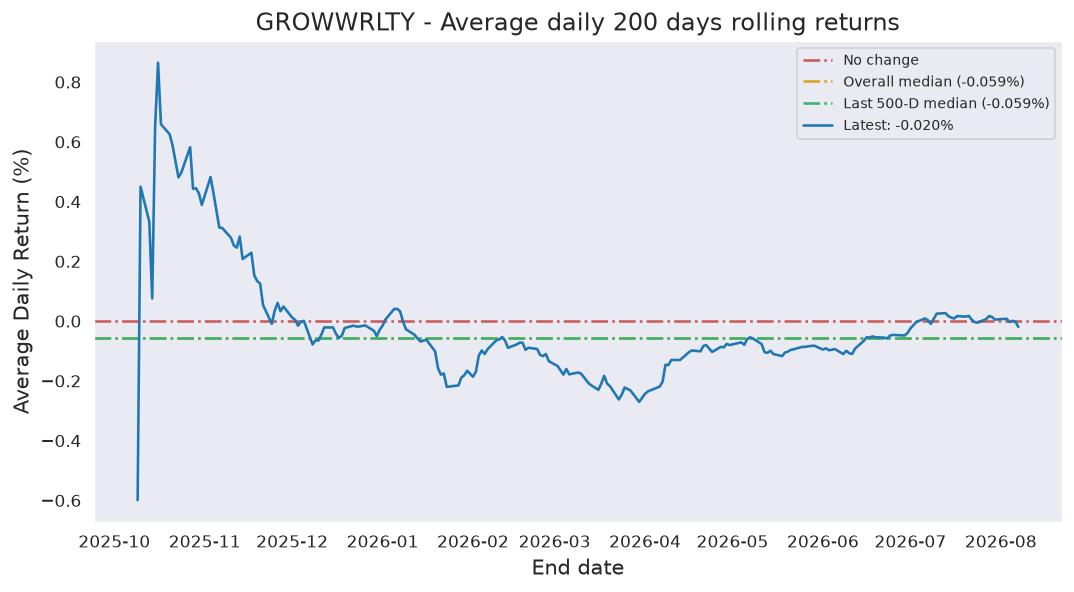
Average of last 200 days: 9.25
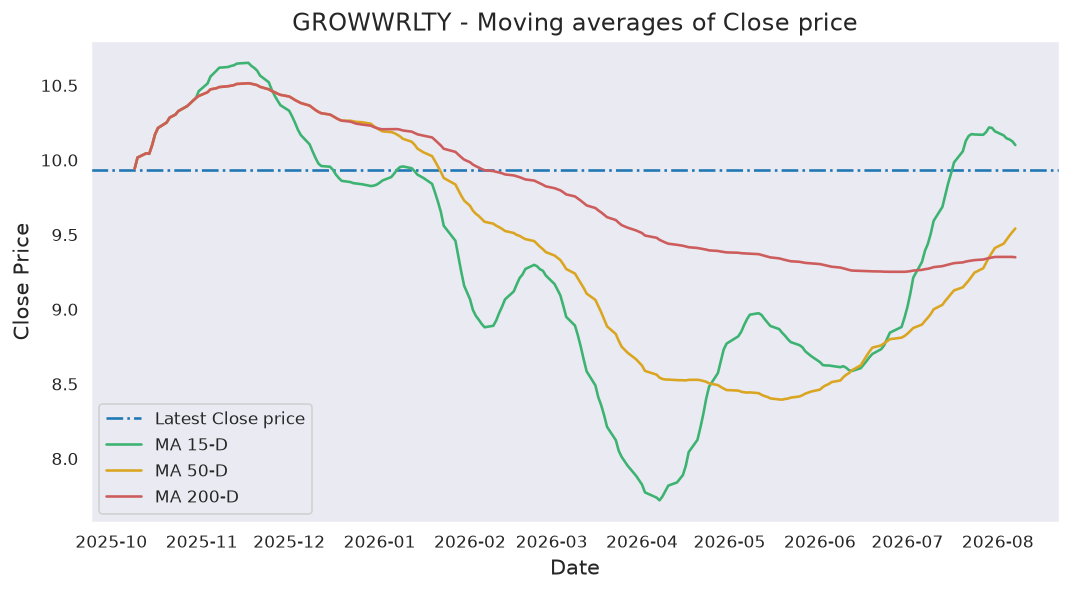
Analysis based on 243 records from October 09, 2025 to October 01, 2026
Last updated on October 02, 2026
| 5 Days | 15 Days | 50 Days | 200 Days | 243 Days | |
|---|---|---|---|---|---|
| Start Date | September 25, 2026 | September 10, 2026 | July 23, 2026 | December 11, 2025 | October 09, 2025 |
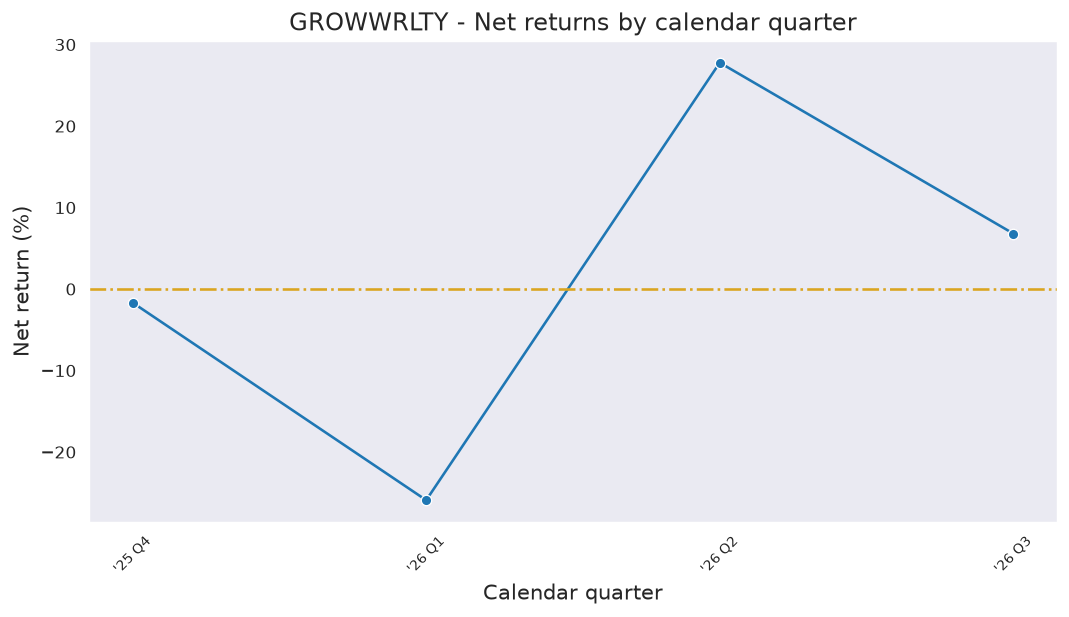
| Net Return | -2.29% | -4.78% | -7.04% | -3.60% | -6.30% |
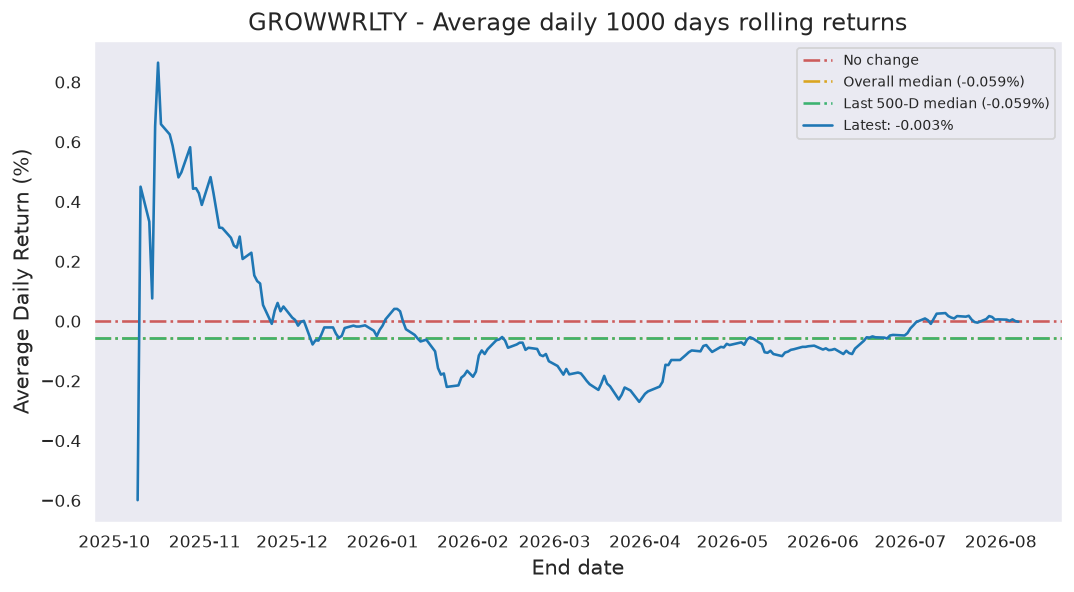
| Average Daily Return | -0.463% | -0.326% | -0.146% | -0.018% | -0.027% |
| Median Close Price | 9.48 | 9.54 | 10.00 | 9.25 | 9.57 |
| Lowest Close Price | 9.36 | 9.22 | 9.22 | 7.28 | 7.28 |
| Highest Close Price | 9.71 | 9.76 | 10.32 | 10.50 | 10.85 |
| Mean Value Traded | 1.62M | 4.96M | 3.57M | 3.07M | 2.76M |
Last close price: 9.37
Average of last 15 days: 9.51
Average of last 50 days: 9.91
Average of last 200 days: 9.25
GROWWRLTY first closed above its last close price on Thursday, October 09, 2025 which was 358 days ago.
Since then, it has closed over this price 55.6% of times which is 135 trading days.
Previously, GROWWRLTY closed above its last close price on Wednesday, September 30, 2026 which was 2 days ago.
Historically, this stock gave a non-positive return for a maximum period of 357 days which was from October 09, 2025 to October 01, 2026.
Last candle: Red (-1.16%)
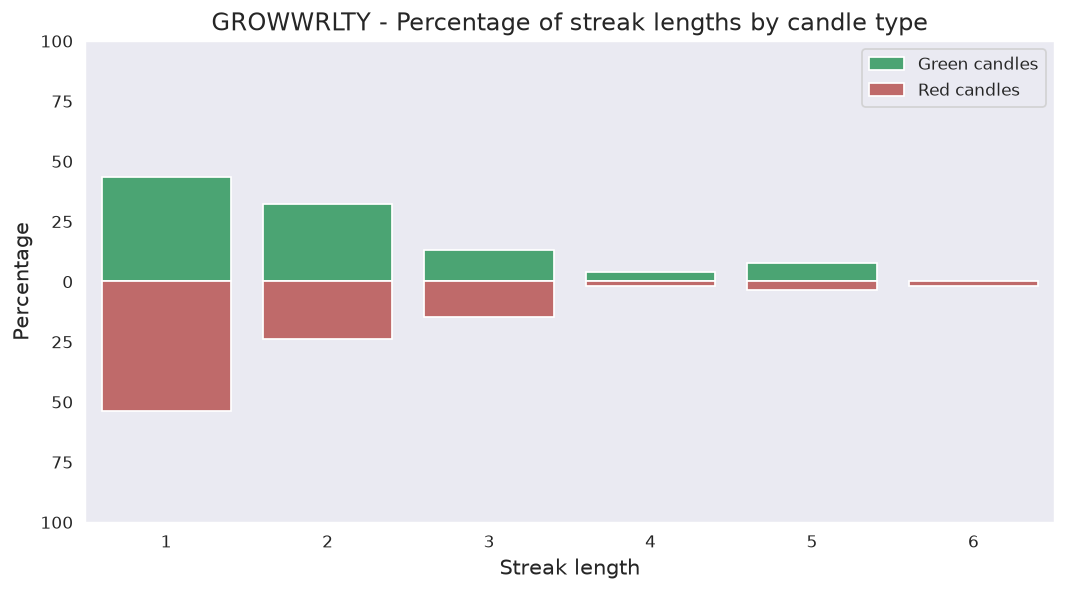
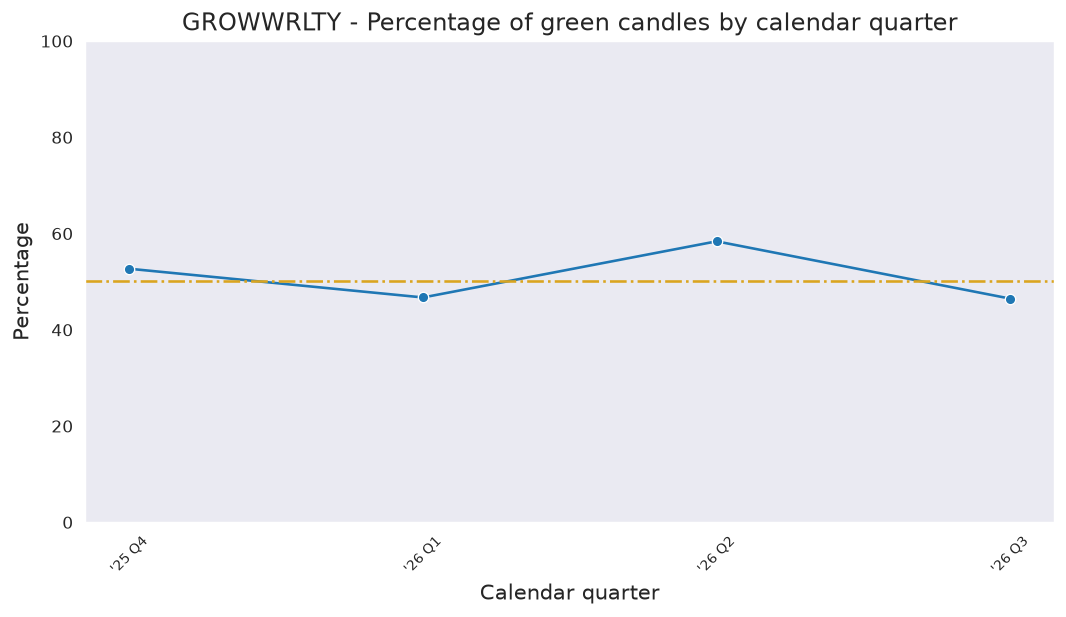
Overall percentage of Red candles: 49.4%
Current streak of Red candles: 1
Net change so far for the current streak: -1.16%
Probability of streak continuing: 48.4%
Longest streak of Red candles: 6 trading days from September 07, 2026 to September 15, 2026
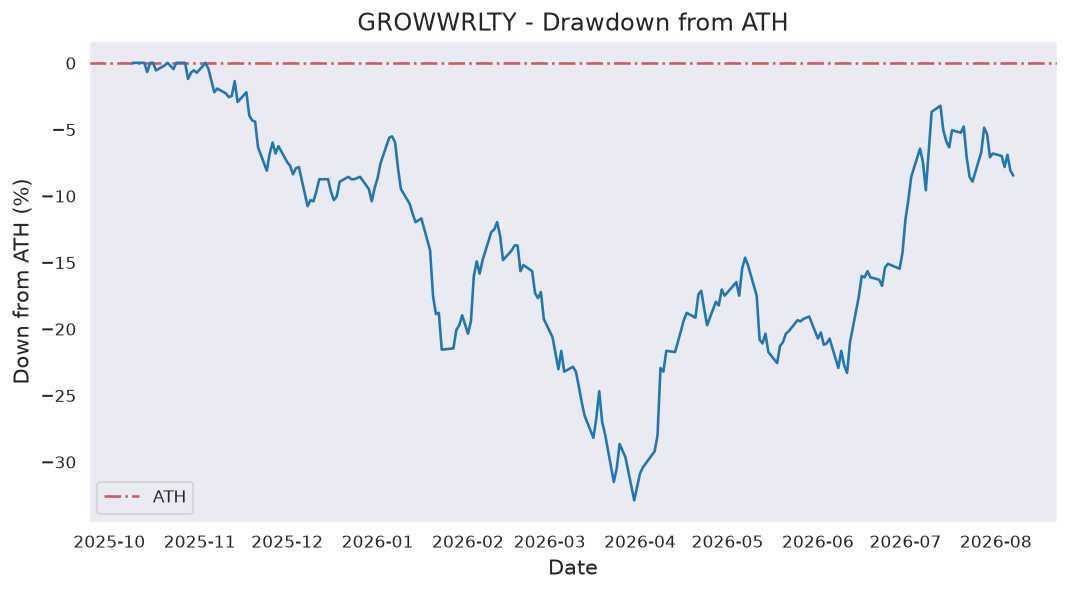
Current down from ATH: -13.64%
Most down from ATH: -32.90%
ATH hits in last 1000 days: 9
ATH was last hit on Monday, November 03, 2025.