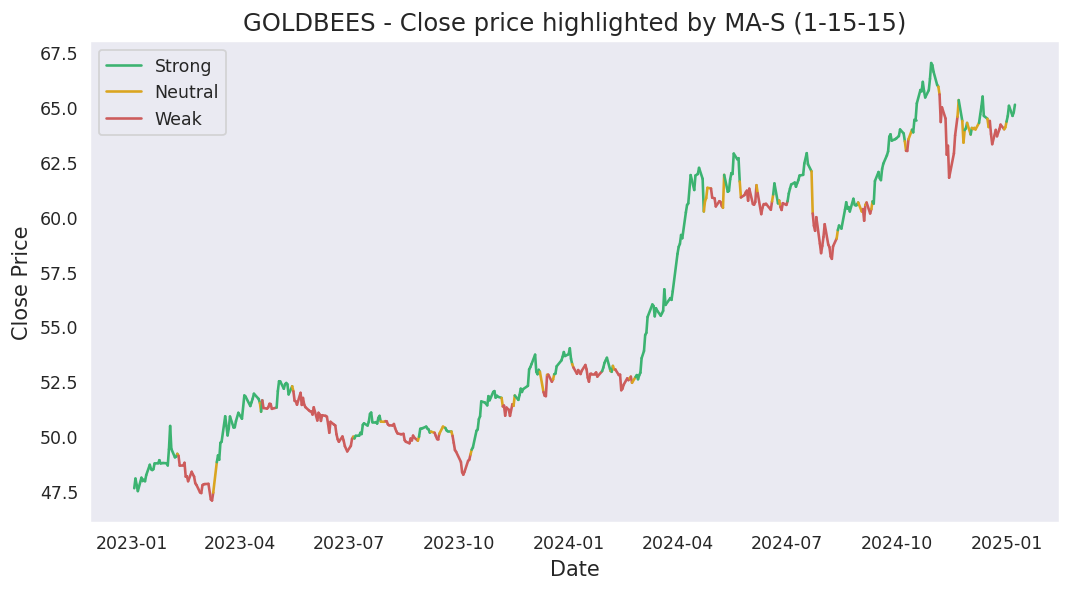
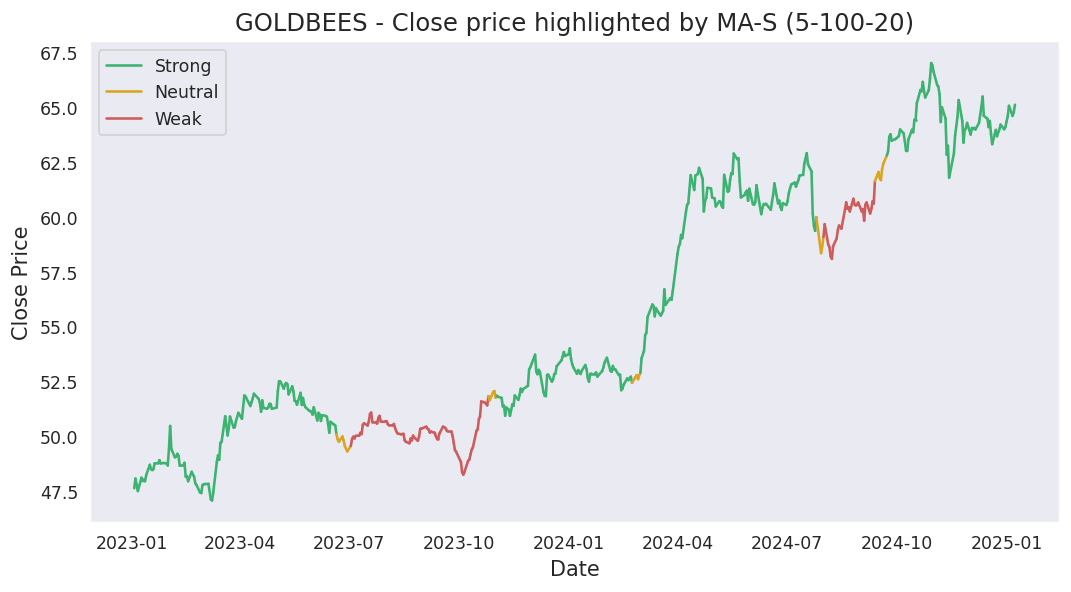
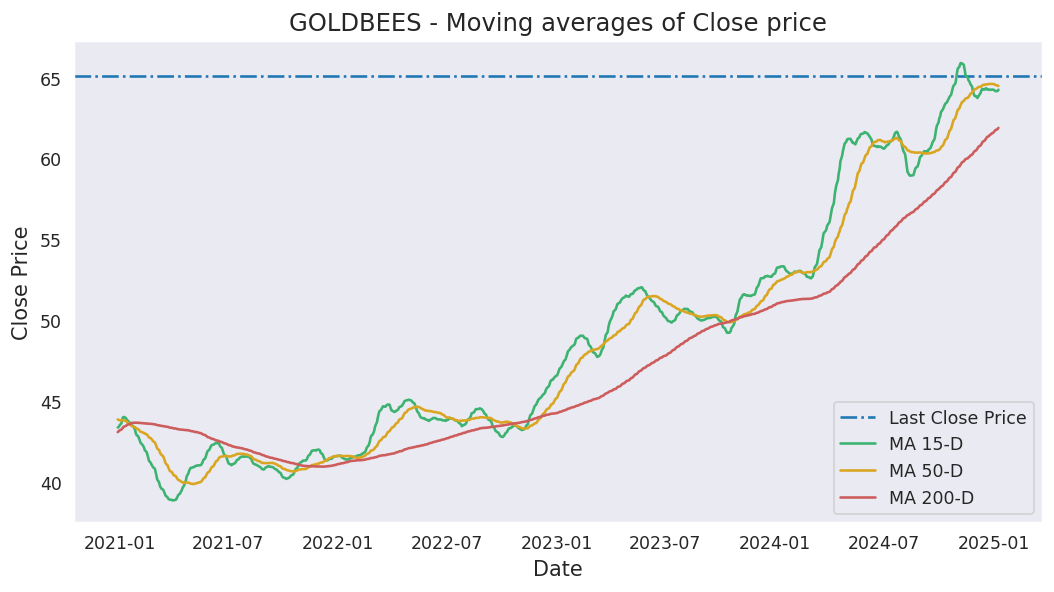
Moving averages
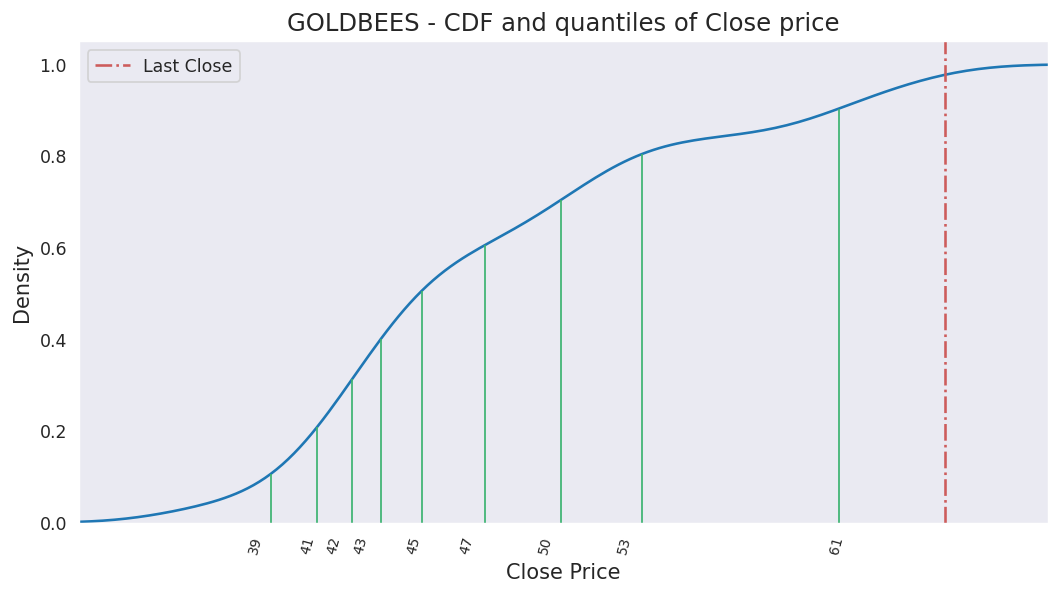
Last close price: 119.79
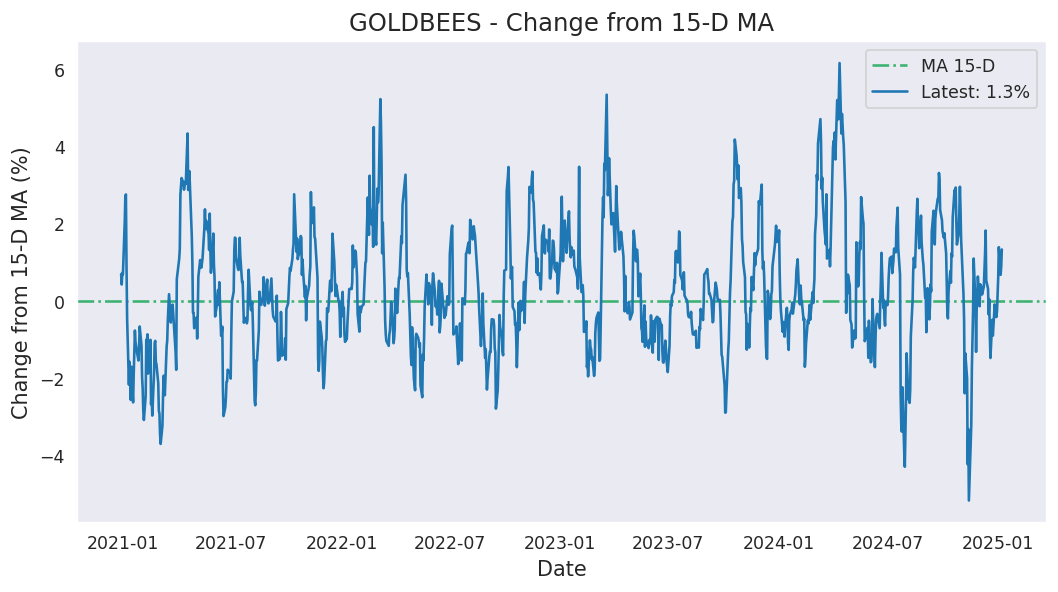
Average of last 15 days: 124.39
Average of last 50 days: 125.58
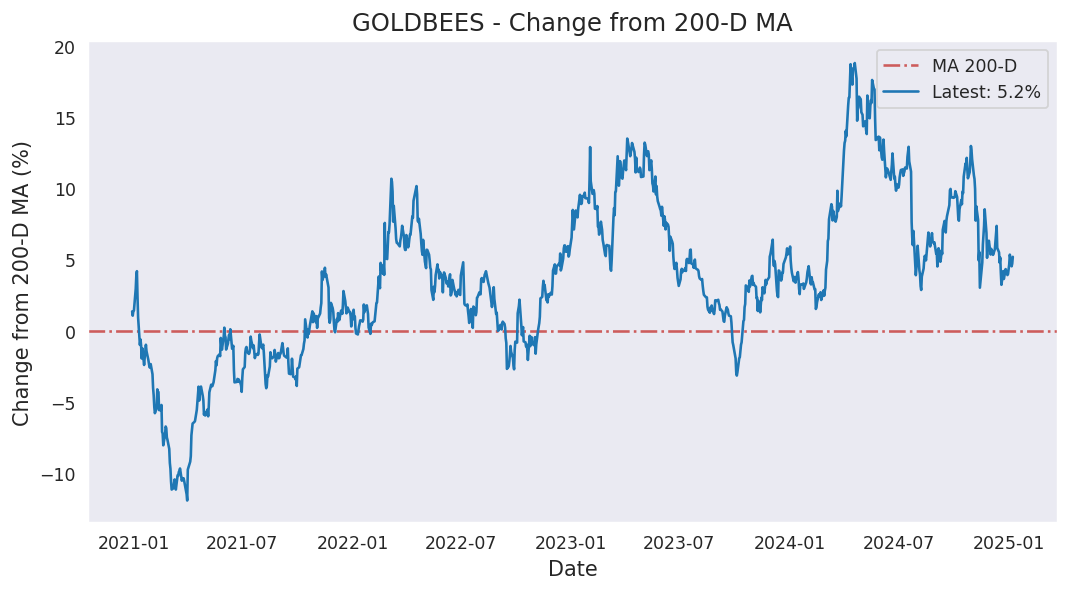
Average of last 200 days: 114.71
Analysis based on 1606 records from January 01, 2020 to June 19, 2026
Last updated on June 19, 2026
| 5 Days | 15 Days | 50 Days | 200 Days | 1000 Days | |
|---|---|---|---|---|---|
| Start Date | June 15, 2026 | June 01, 2026 | April 08, 2026 | August 28, 2025 | June 08, 2022 |
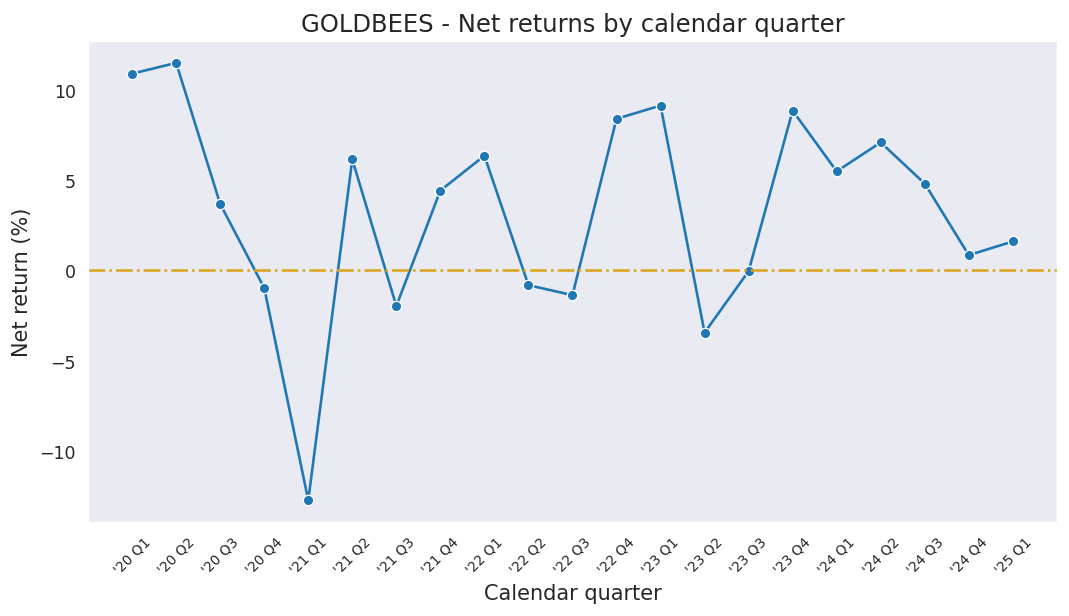
| Net Return | -1.75% | -6.89% | -1.63% | 42.90% | 173.12% |
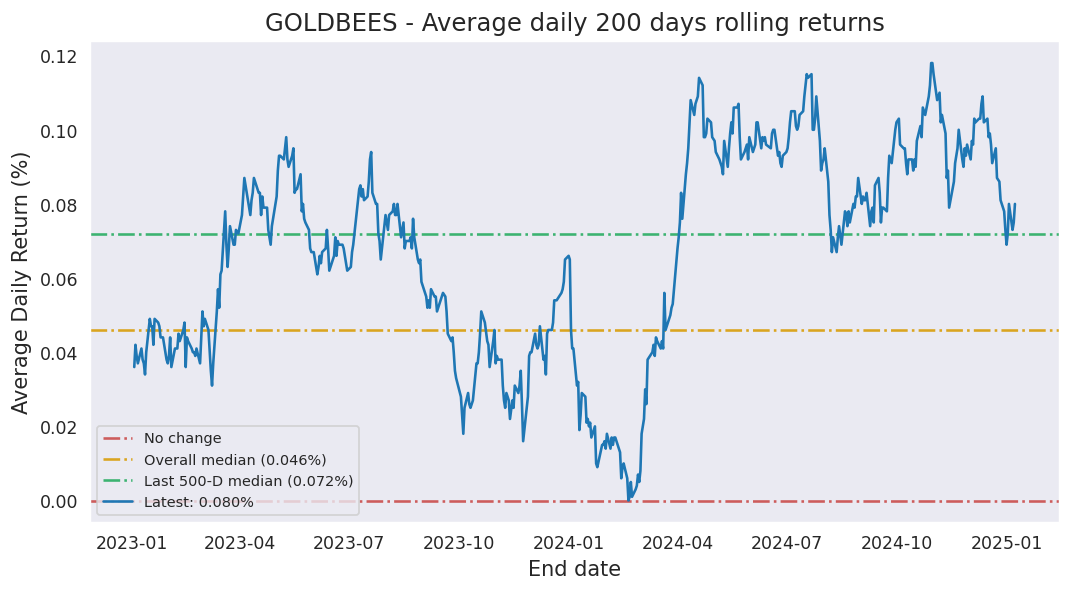
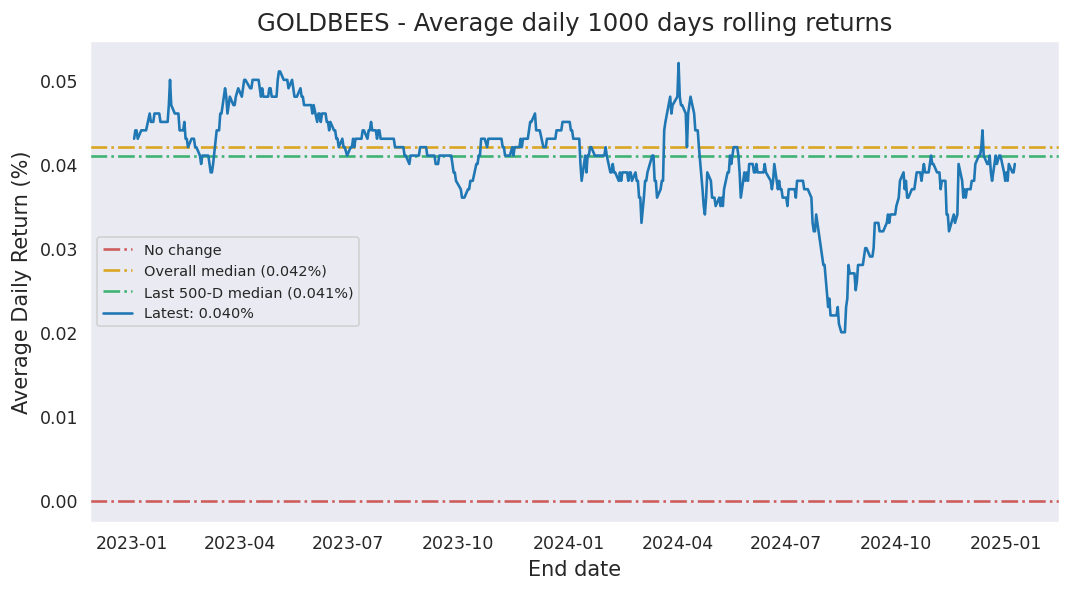
| Average Daily Return | -0.352% | -0.475% | -0.033% | 0.179% | 0.101% |
| Median Close Price | 123.75 | 124.14 | 124.54 | 118.34 | 60.59 |
| Lowest Close Price | 119.79 | 119.28 | 119.28 | 84.42 | 42.26 |
| Highest Close Price | 124.14 | 128.67 | 131.78 | 146.53 | 146.53 |
| Mean Value Traded | 2.82B | 3.28B | 3.79B | 6.26B | 1.65B |
Last close price: 119.79
Average of last 15 days: 124.39
Average of last 50 days: 125.58
Average of last 200 days: 114.71
GOLDBEES first closed above its last close price on Monday, January 19, 2026 which was 151 days ago.
Since then, it has closed over this price 94.2% of times which is 97 trading days.
Previously, GOLDBEES closed above its last close price on Thursday, June 18, 2026 which was 1 days ago.
Historically, this stock gave a non-positive return for a maximum period of 1160 days which was from August 07, 2020 to October 11, 2023.
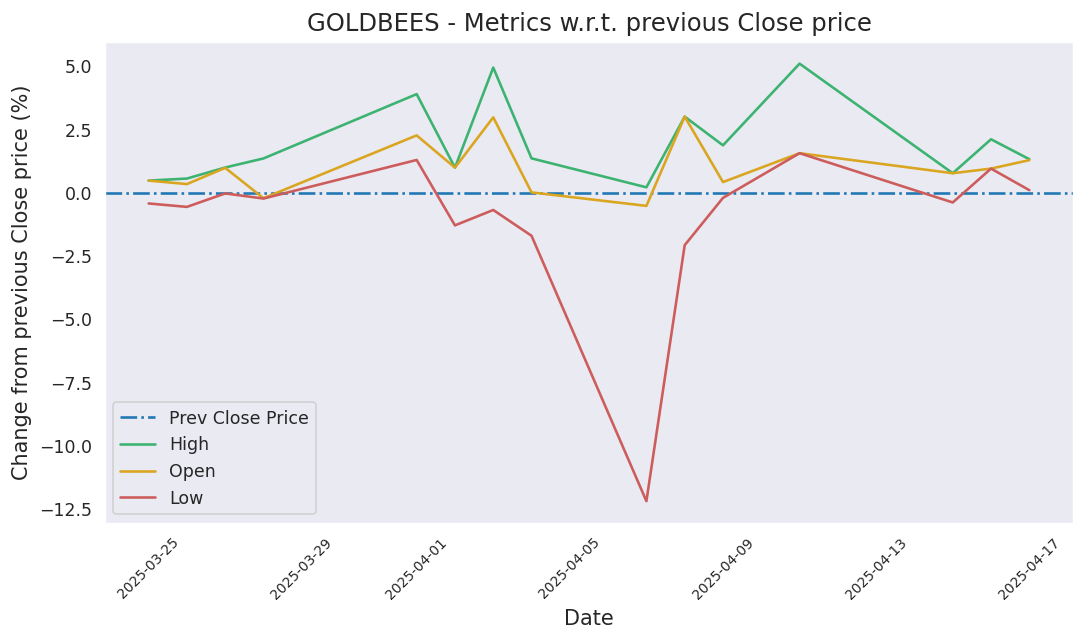
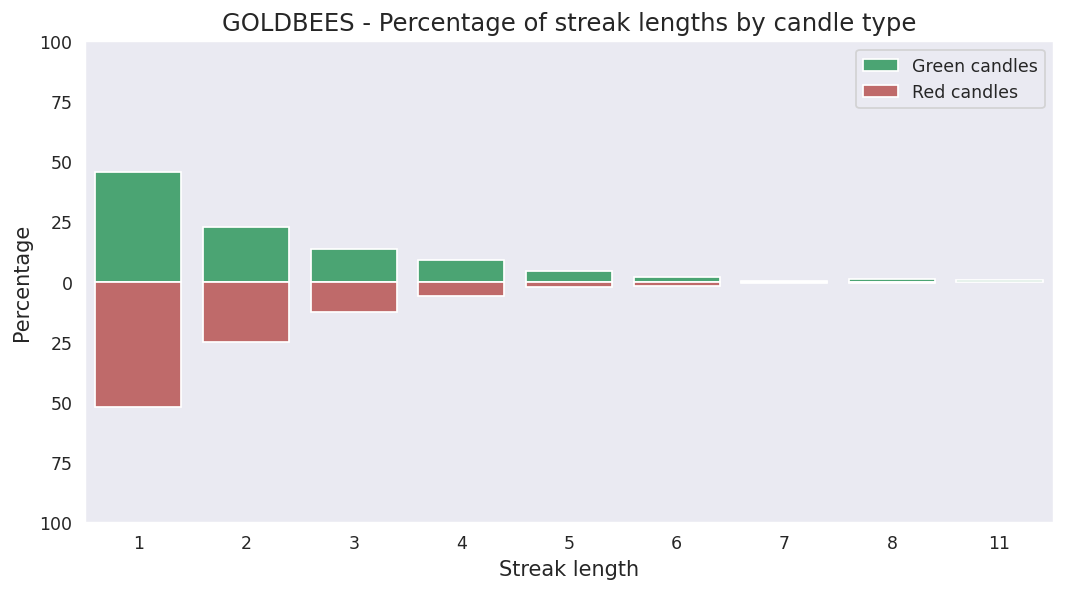
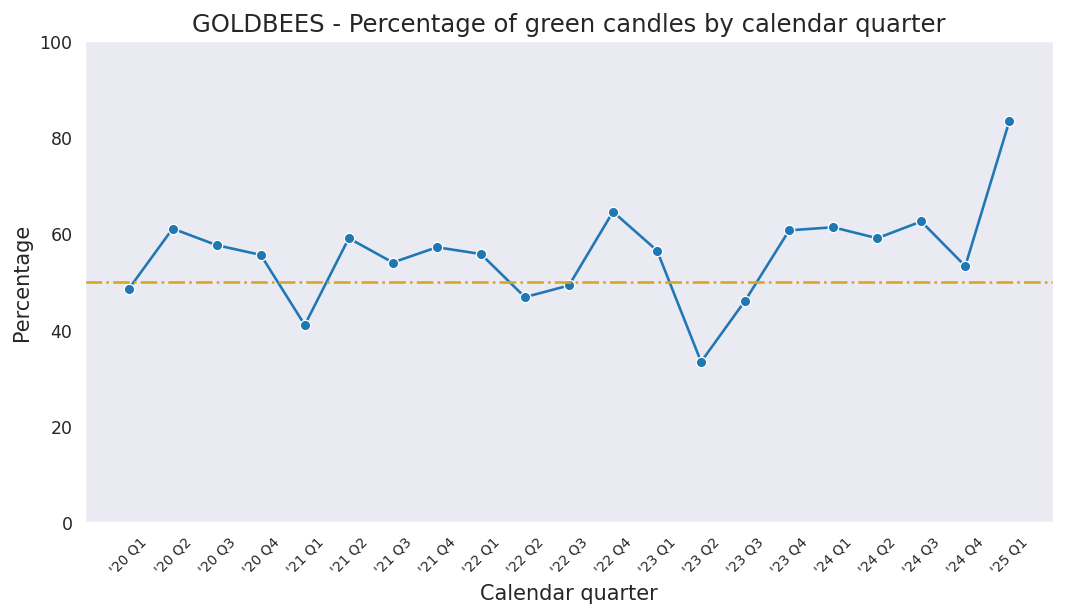
Last candle: Red (-1.91%)
Overall percentage of Red candles: 45.4%
Current streak of Red candles: 3
Net change so far for the current streak: -3.50%
Probability of streak continuing: 43.7%
Longest streak of Red candles: 8 trading days from February 24, 2021 to March 05, 2021
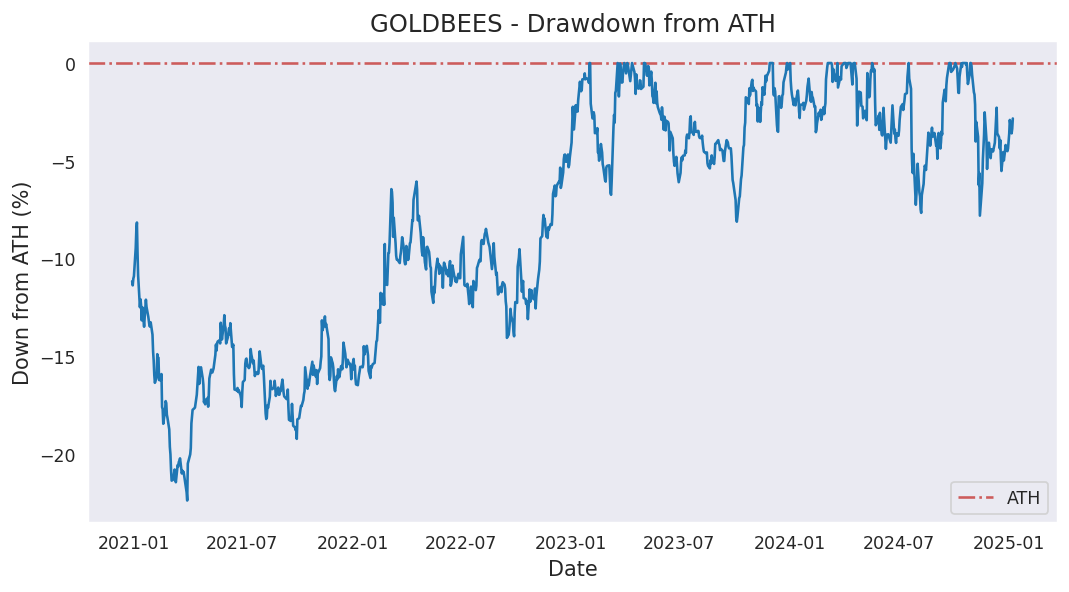
Current down from ATH: -18.25%
Most down from ATH: -24.44%
ATH hits in last 1000 days: 104
ATH was last hit on Thursday, January 29, 2026.