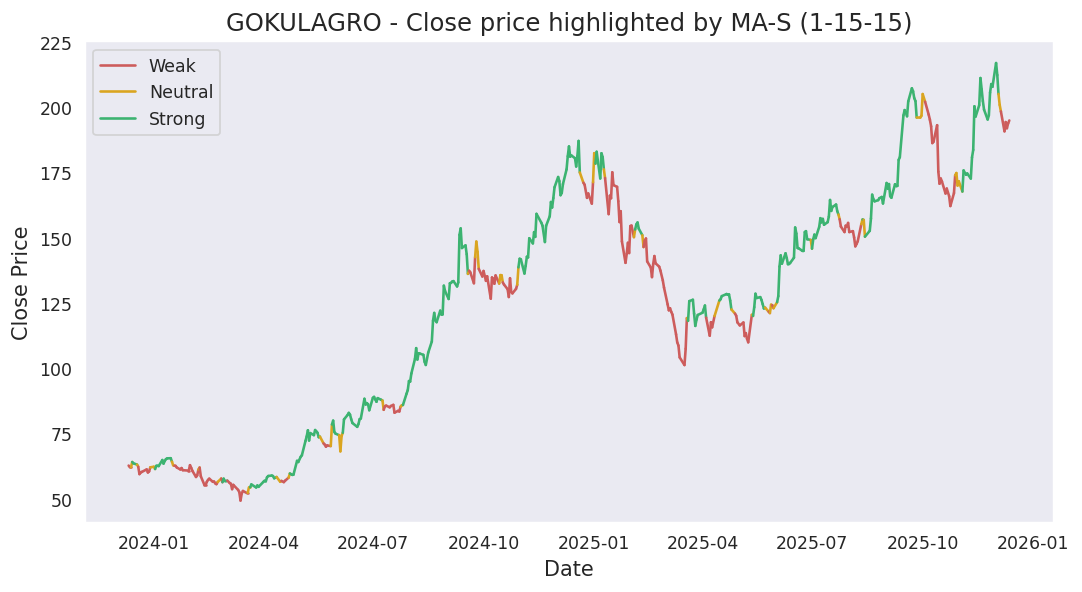
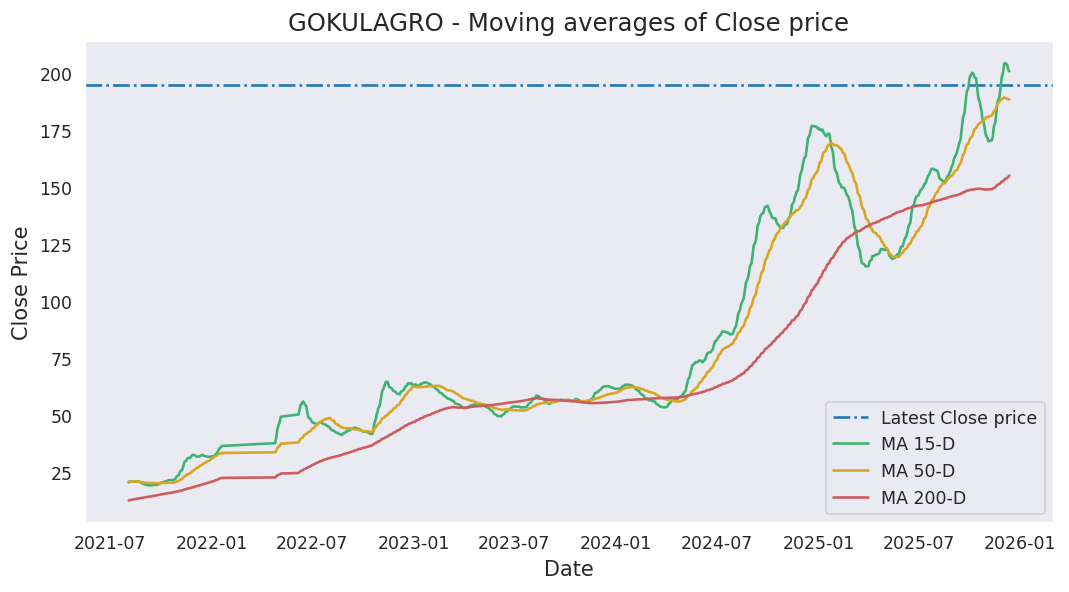
Moving averages
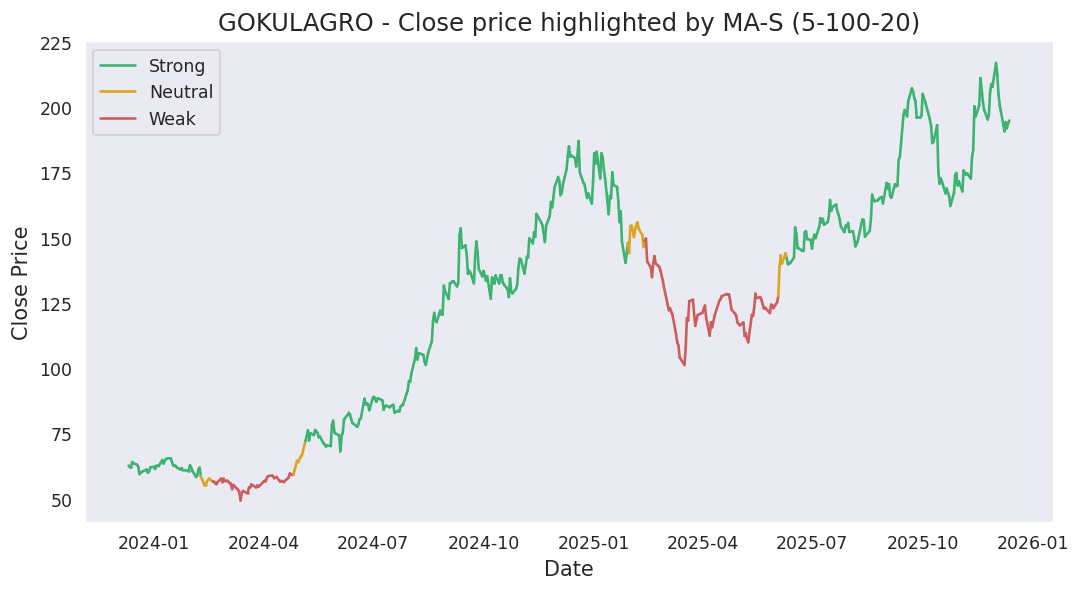
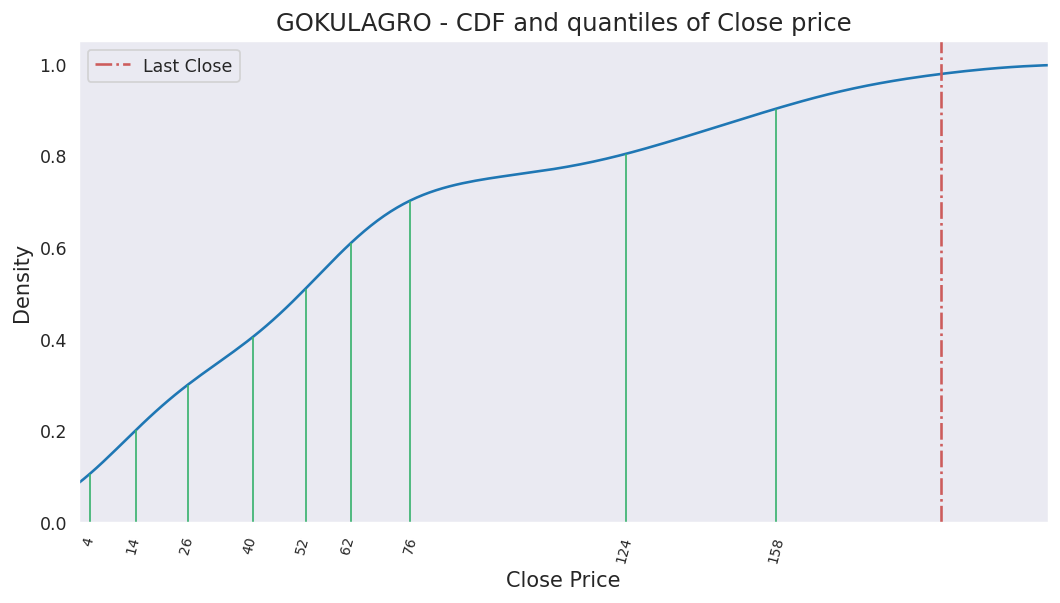
Last close price: 221.77
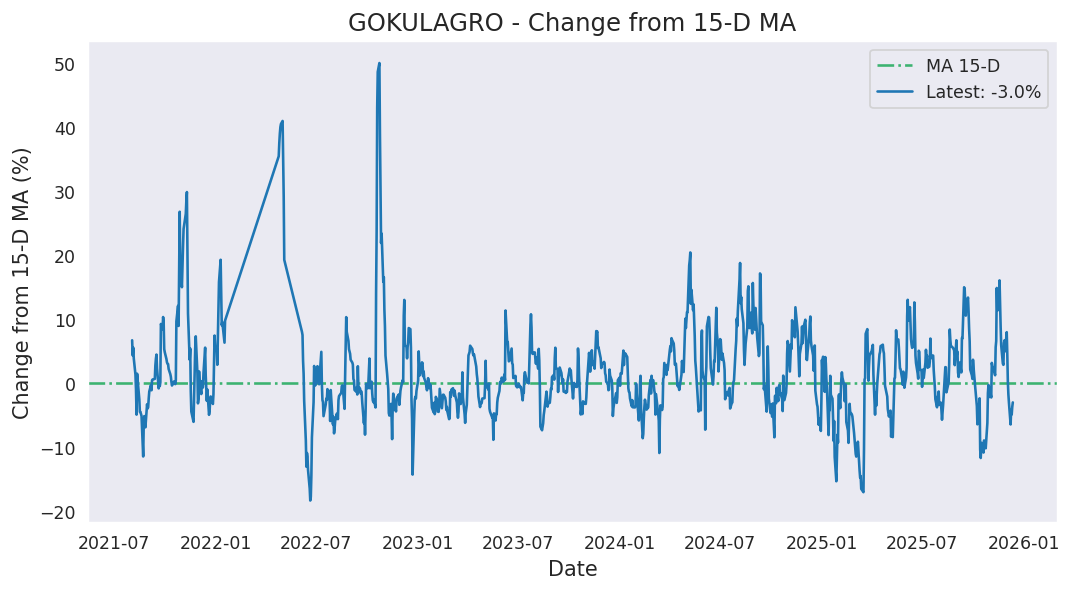
Average of last 15 days: 229.64
Average of last 50 days: 226.31
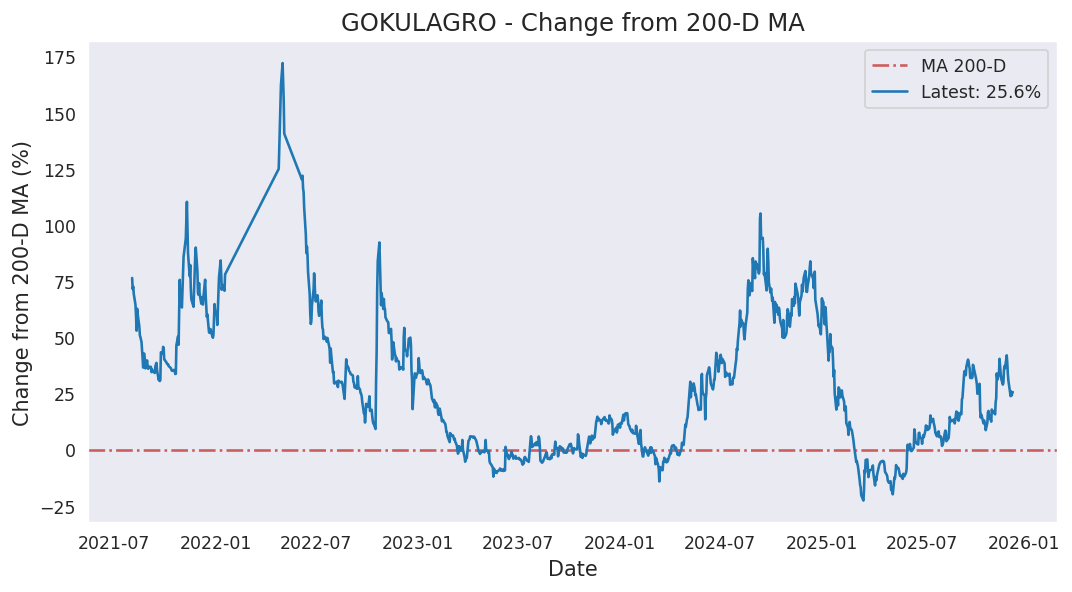
Average of last 200 days: 191.39
Analysis based on 1522 records from January 01, 2020 to June 19, 2026
Last updated on June 19, 2026
| 5 Days | 15 Days | 50 Days | 200 Days | 1000 Days | |
|---|---|---|---|---|---|
| Start Date | June 15, 2026 | June 01, 2026 | April 08, 2026 | August 28, 2025 | June 08, 2022 |
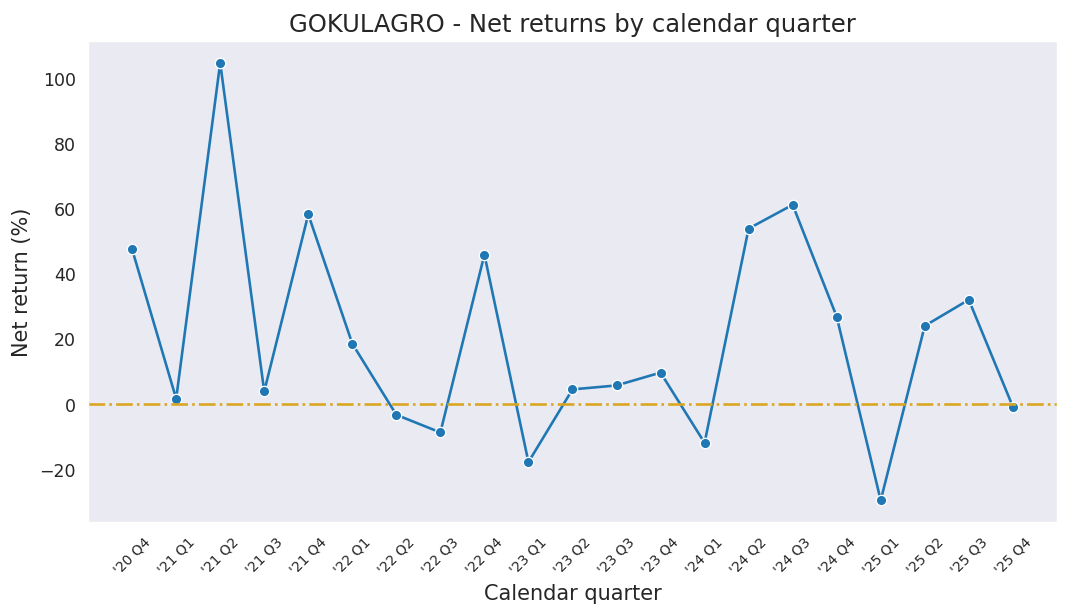
| Net Return | -4.85% | -3.19% | 12.59% | 34.24% | 300.49% |
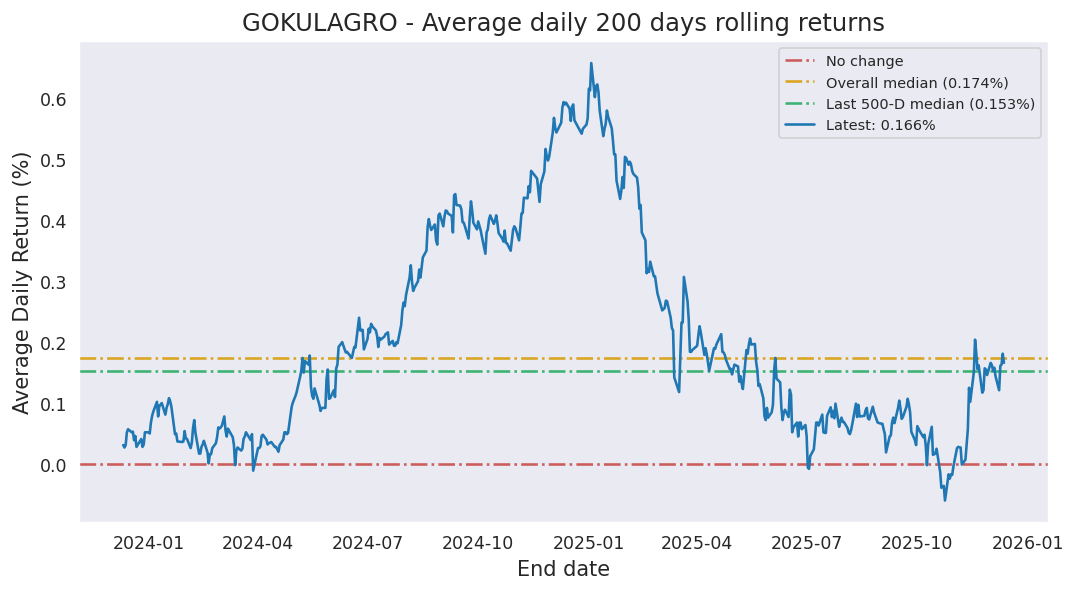
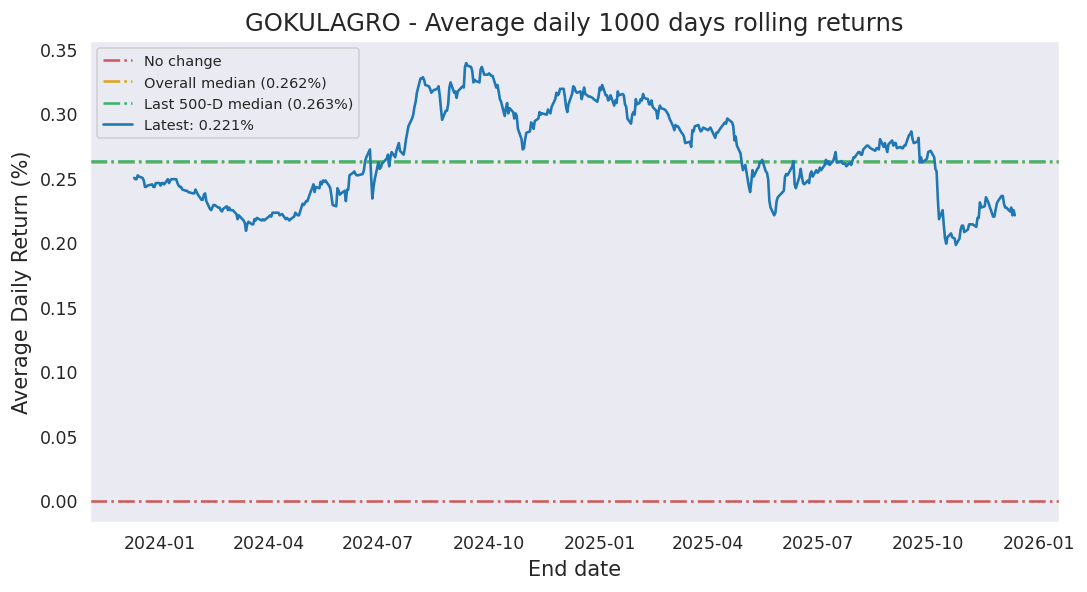
| Average Daily Return | -0.989% | -0.216% | 0.237% | 0.147% | 0.139% |
| Median Close Price | 223.12 | 231.62 | 230.06 | 188.66 | 80.45 |
| Lowest Close Price | 221.77 | 221.77 | 198.65 | 152.82 | 39.77 |
| Highest Close Price | 228.41 | 233.90 | 242.83 | 242.83 | 242.83 |
| Mean Value Traded | 110.92M | 85.41M | 285.37M | 254.25M | 105.85M |
Last close price: 221.77
Average of last 15 days: 229.64
Average of last 50 days: 226.31
Average of last 200 days: 191.39
GOKULAGRO first closed above its last close price on Wednesday, April 22, 2026 which was 58 days ago.
Since then, it has closed over this price 95.1% of times which is 39 trading days.
Previously, GOKULAGRO closed above its last close price on Thursday, June 18, 2026 which was 1 days ago.
Historically, this stock gave a non-positive return for a maximum period of 729 days which was from April 28, 2022 to April 26, 2024.
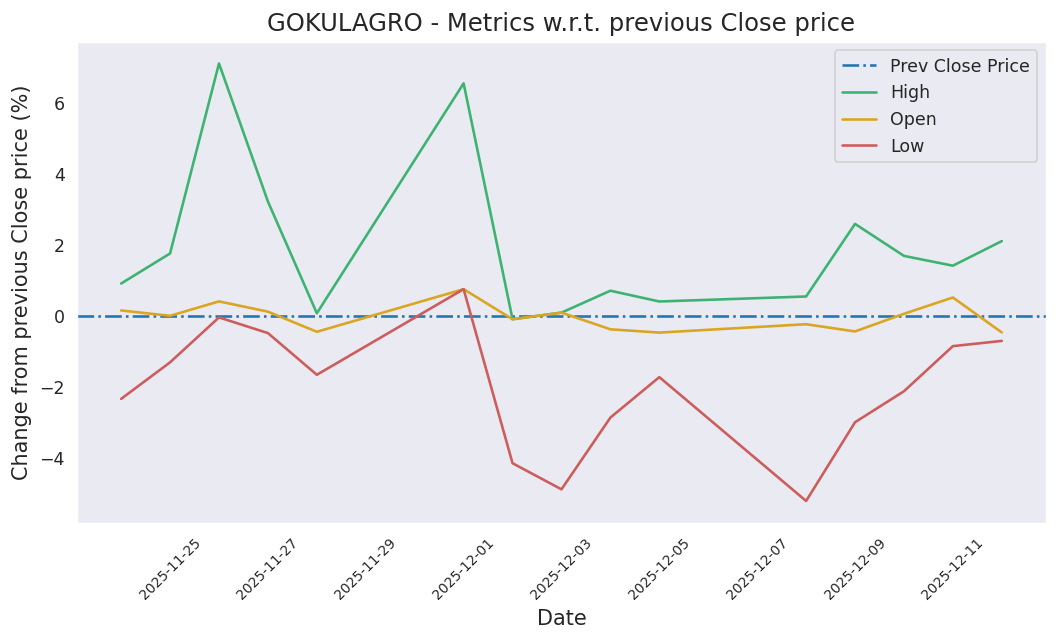
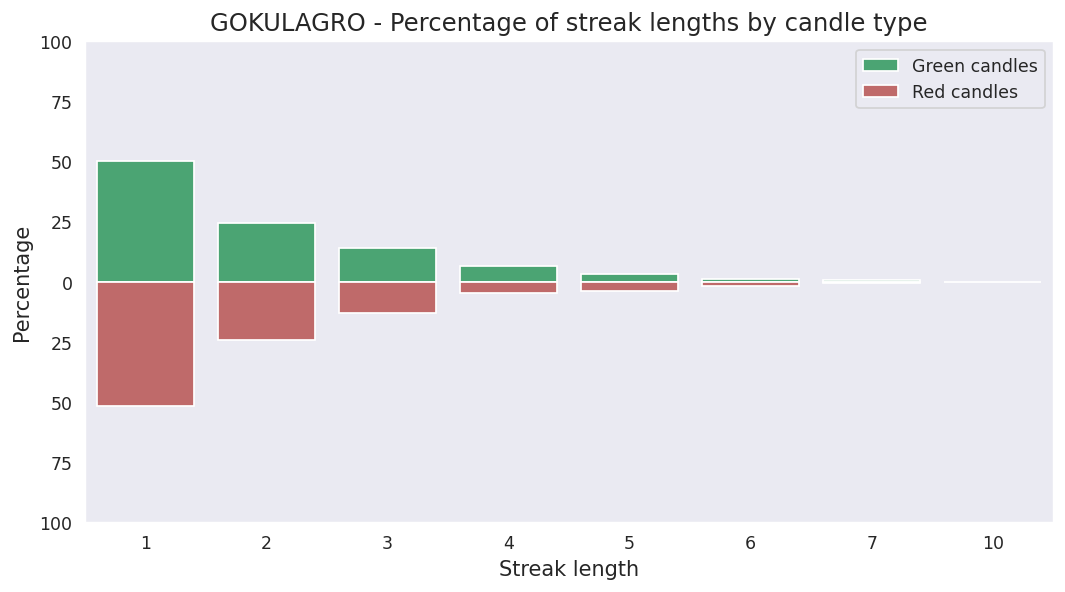
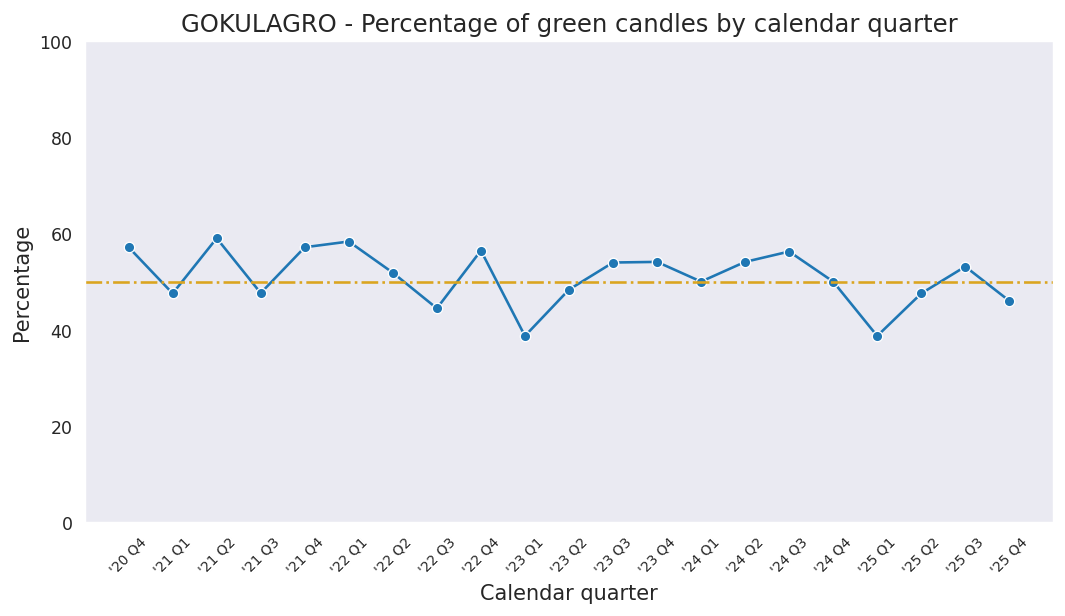
Last candle: Red (-1.73%)
Overall percentage of Red candles: 50.2%
Current streak of Red candles: 2
Net change so far for the current streak: -2.91%
Probability of streak continuing: 50.0%
Longest streak of Red candles: 10 trading days from March 09, 2020 to March 23, 2020
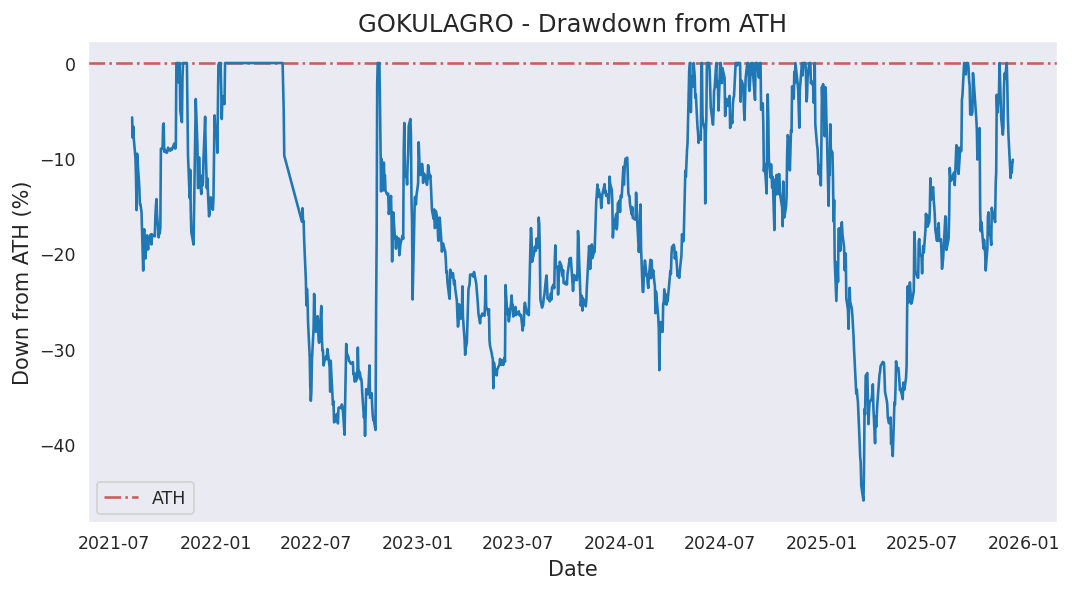
Current down from ATH: -8.67%
Most down from ATH: -53.57%
ATH hits in last 1000 days: 51
ATH was last hit on Thursday, May 14, 2026.