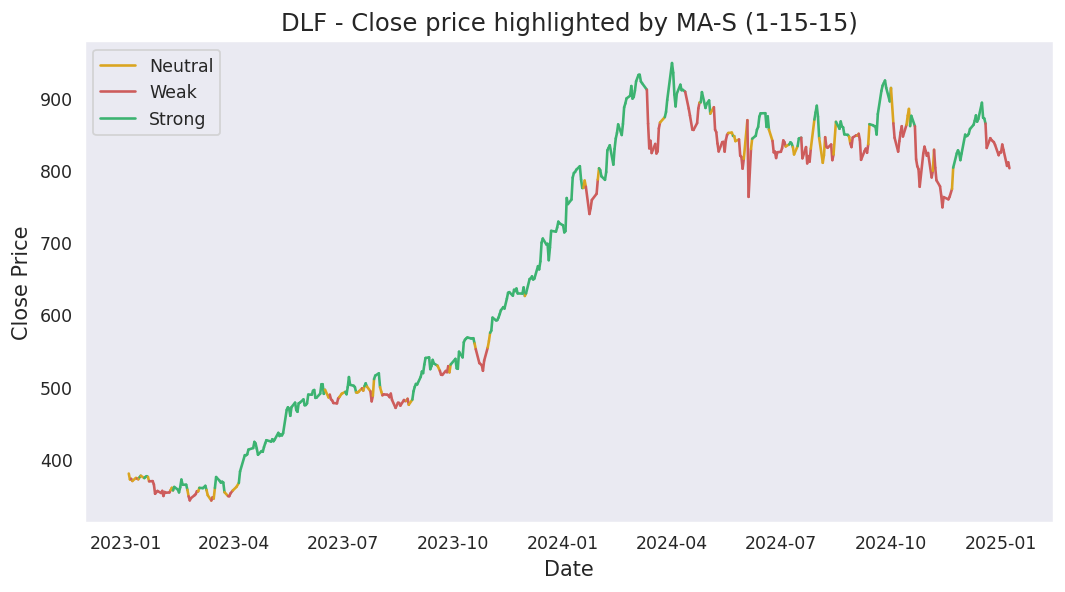
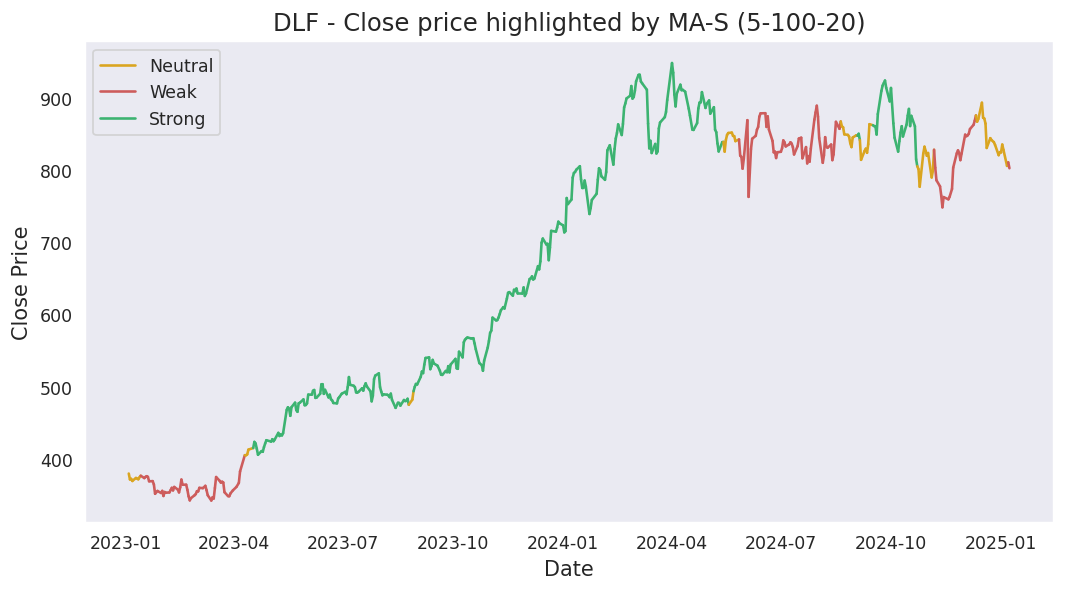
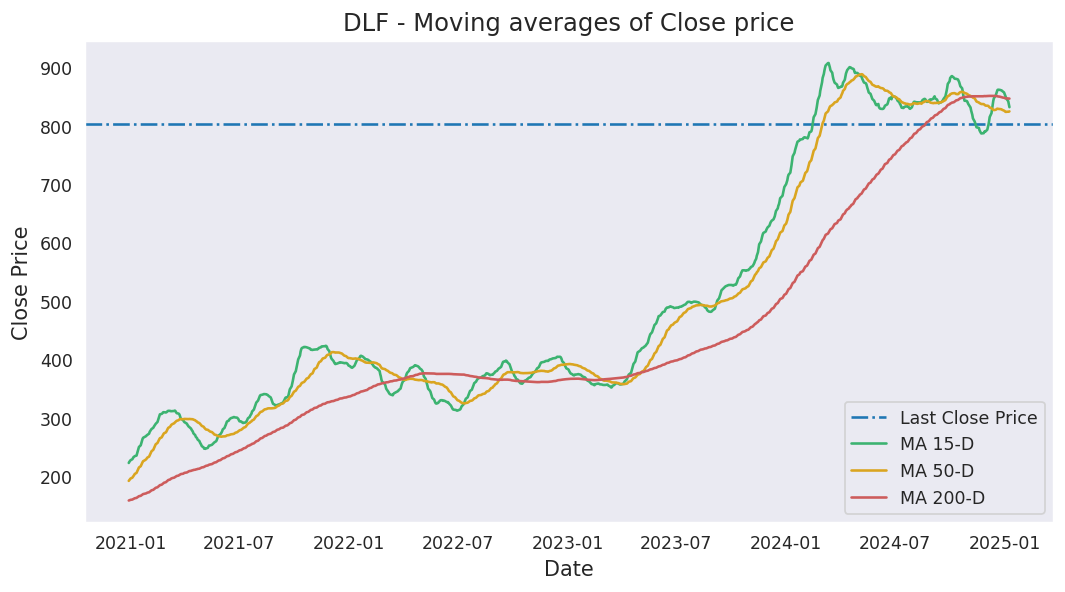
Moving averages
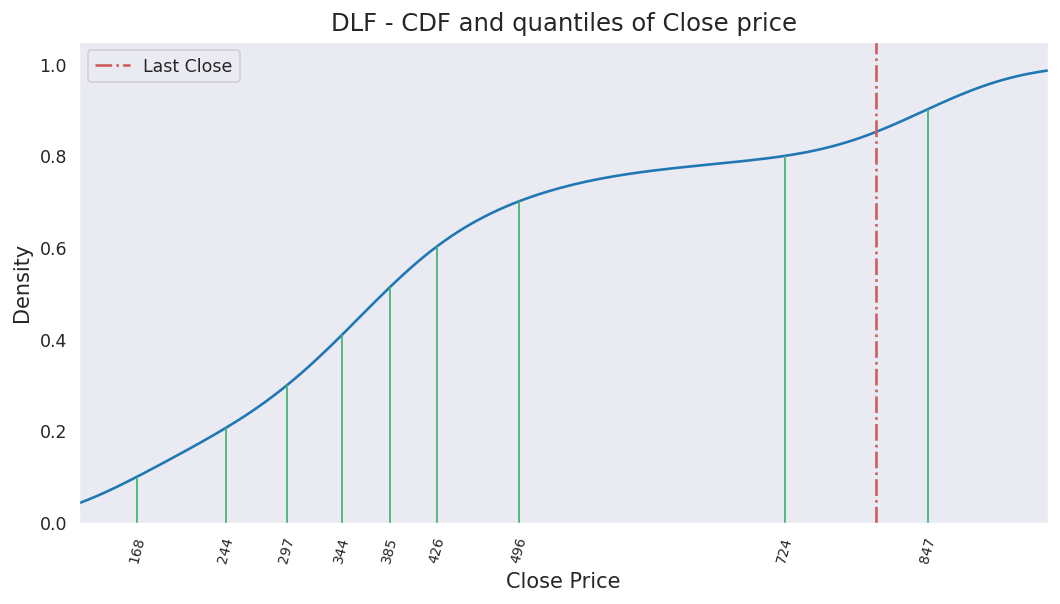
Last close price: 624.5
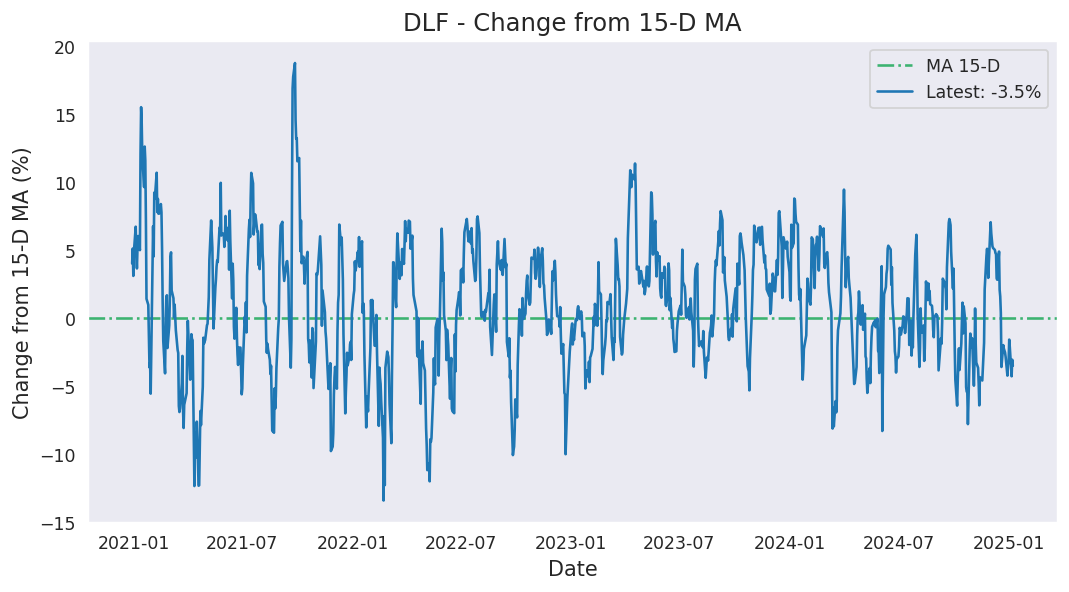
Average of last 15 days: 592.74
Average of last 50 days: 590.00
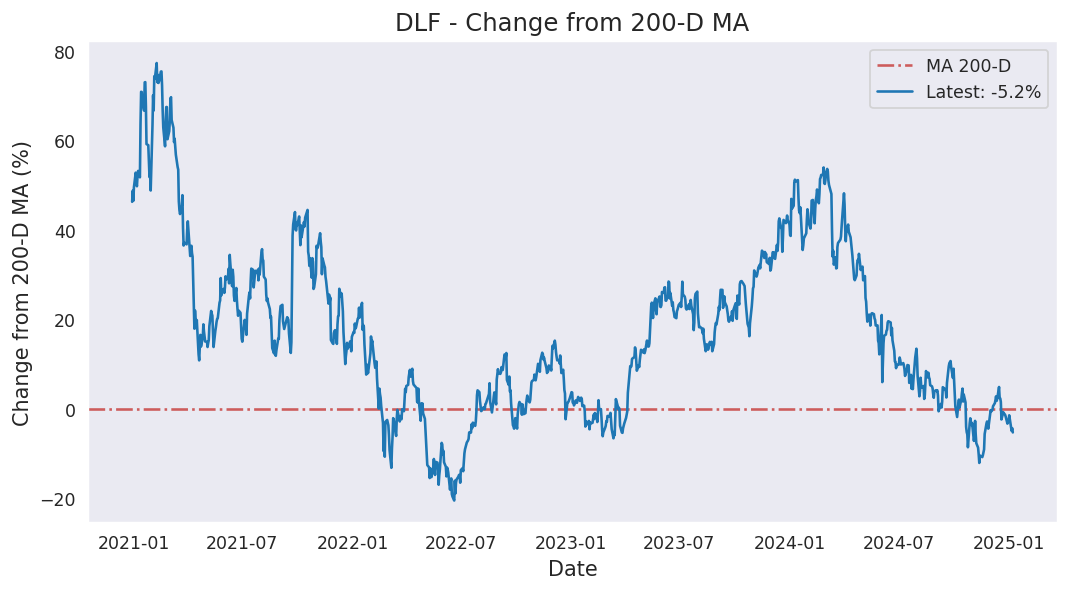
Average of last 200 days: 660.12
Analysis based on 1606 records from January 01, 2020 to June 19, 2026
Last updated on June 19, 2026
| 5 Days | 15 Days | 50 Days | 200 Days | 1000 Days | |
|---|---|---|---|---|---|
| Start Date | June 15, 2026 | June 01, 2026 | April 08, 2026 | August 28, 2025 | June 08, 2022 |
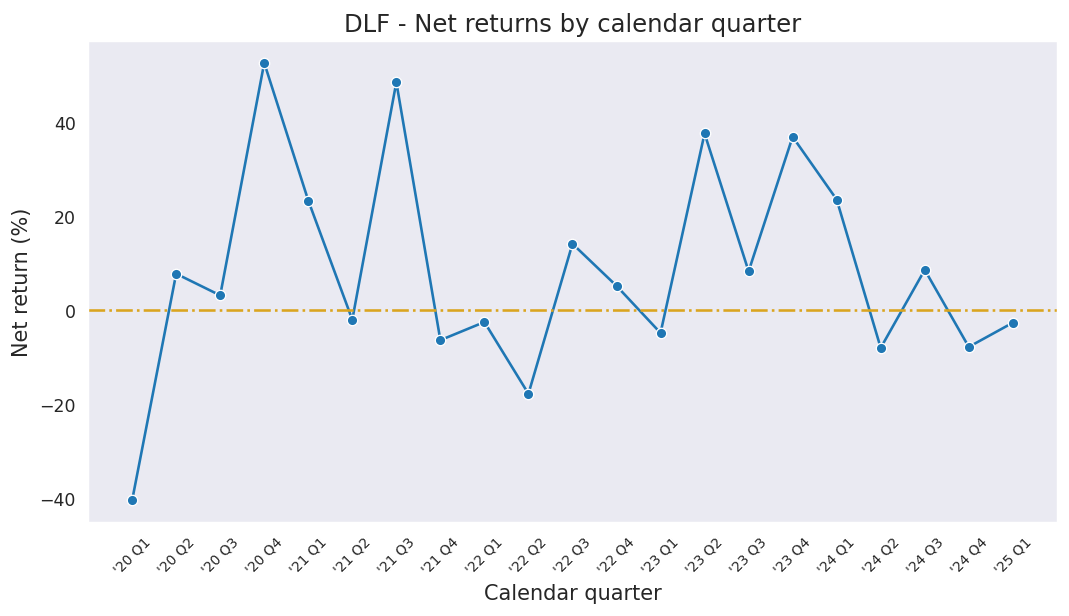
| Net Return | 6.38% | 5.74% | 16.93% | -17.24% | 95.92% |
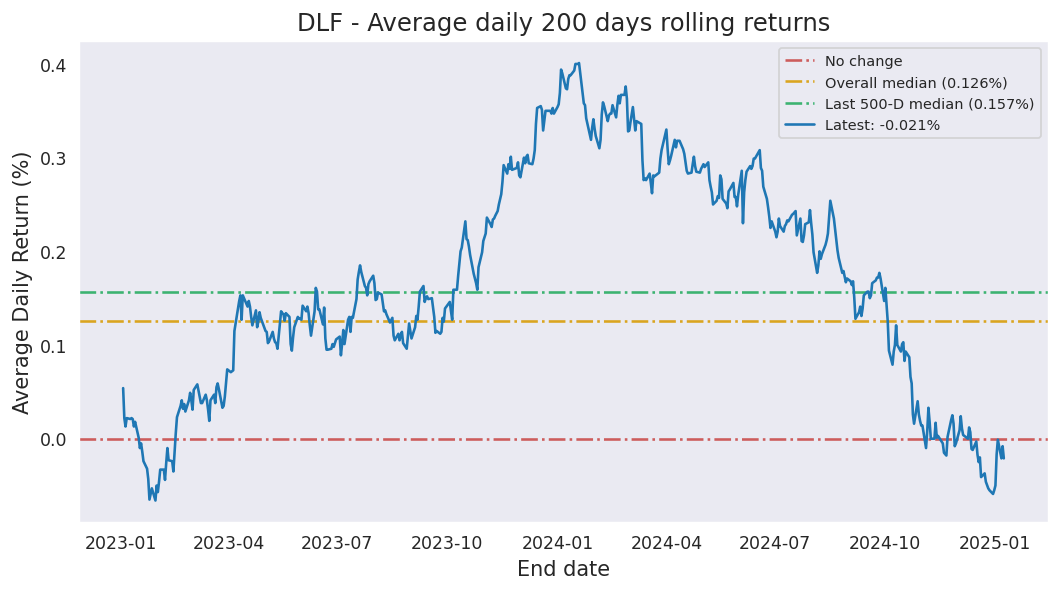
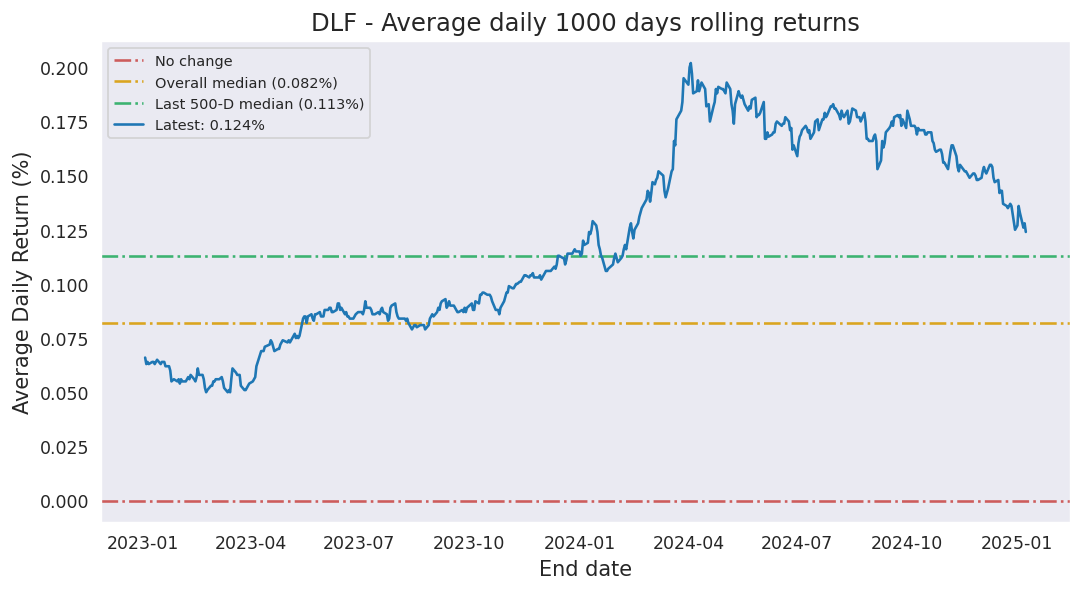
| Average Daily Return | 1.245% | 0.373% | 0.313% | -0.095% | 0.067% |
| Median Close Price | 624.50 | 581.55 | 587.92 | 656.02 | 663.83 |
| Lowest Close Price | 614.45 | 561.30 | 561.30 | 504.10 | 298.50 |
| Highest Close Price | 640.70 | 640.70 | 640.70 | 786.75 | 948.25 |
| Mean Value Traded | 4.09B | 2.61B | 2.49B | 2.22B | 2.49B |
Last close price: 624.5
Average of last 15 days: 592.74
Average of last 50 days: 590.00
Average of last 200 days: 660.12
DLF first closed above its last close price on Thursday, November 16, 2023 which was 946 days ago.
Since then, it has closed over this price 86.8% of times which is 557 trading days.
Previously, DLF closed above its last close price on Thursday, June 18, 2026 which was 1 days ago.
Historically, this stock gave a non-positive return for a maximum period of 1000 days which was from July 06, 2023 to April 01, 2026.
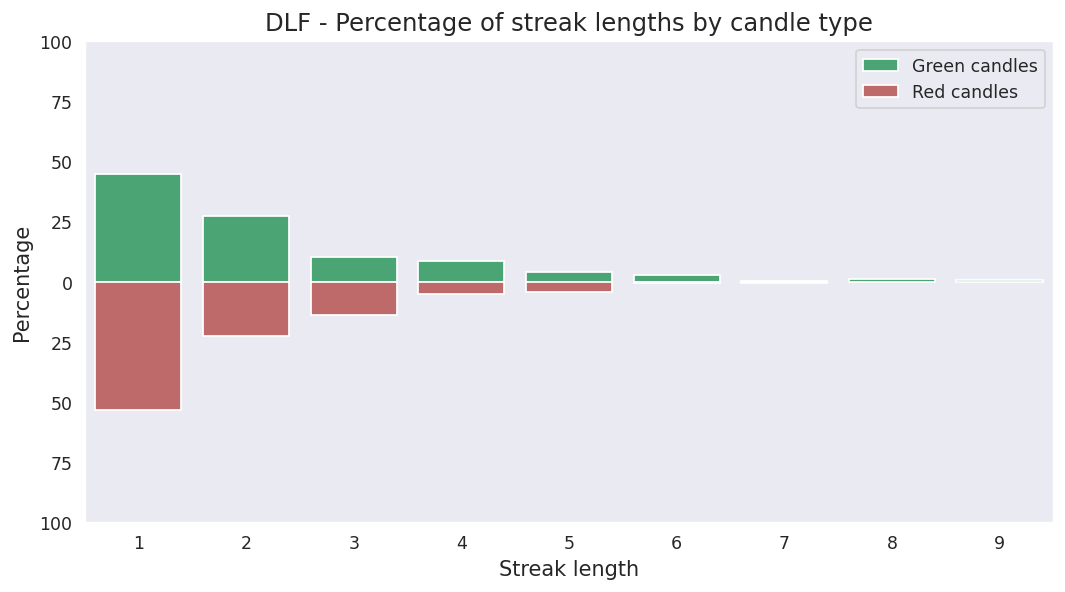
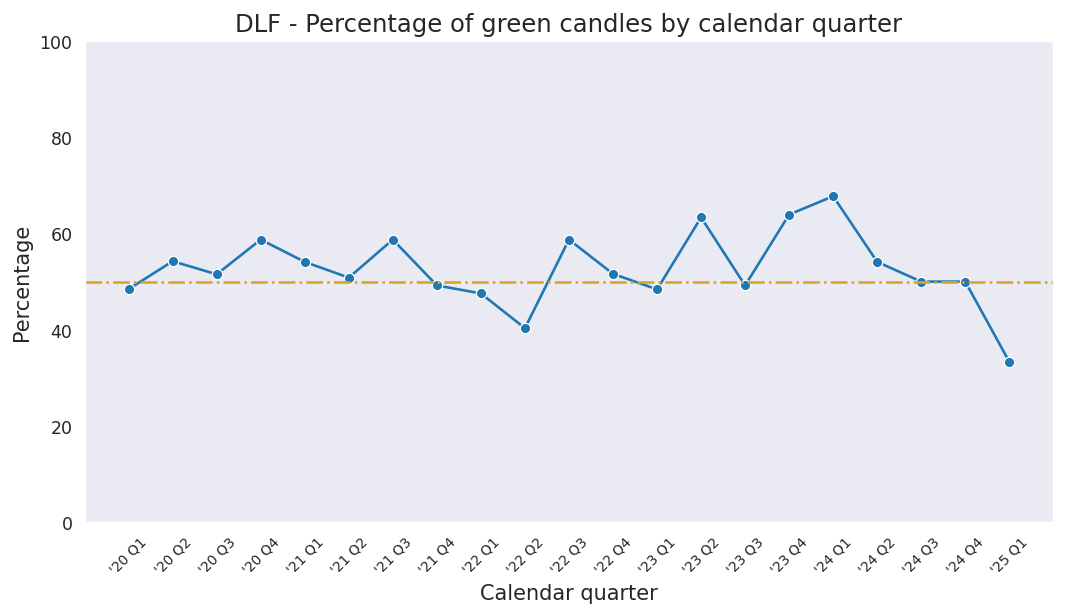
Last candle: Red (-2.53%)
Overall percentage of Red candles: 47.6%
Current streak of Red candles: 1
Net change so far for the current streak: -2.53%
Probability of streak continuing: 47.3%
Longest streak of Red candles: 10 trading days from January 06, 2026 to January 20, 2026
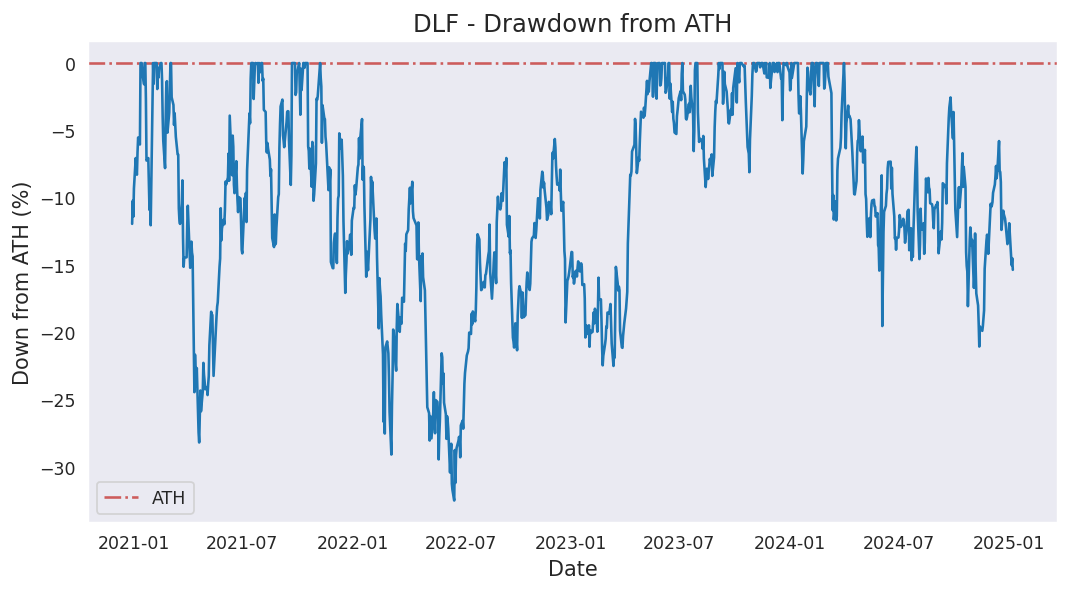
Current down from ATH: -34.14%
Most down from ATH: -54.04%
ATH hits in last 1000 days: 67
ATH was last hit on Monday, April 01, 2024.