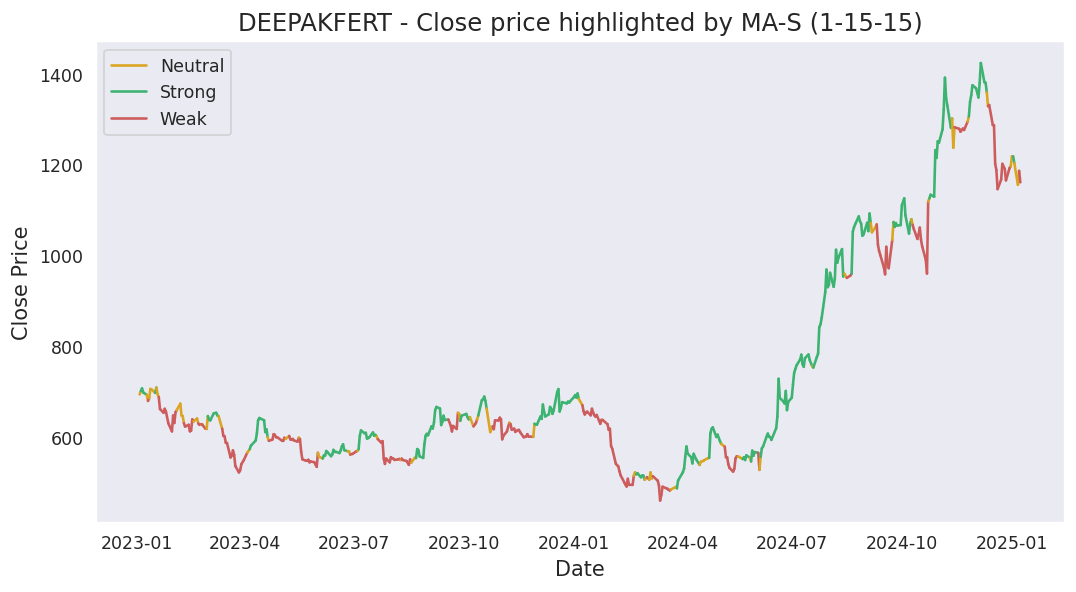
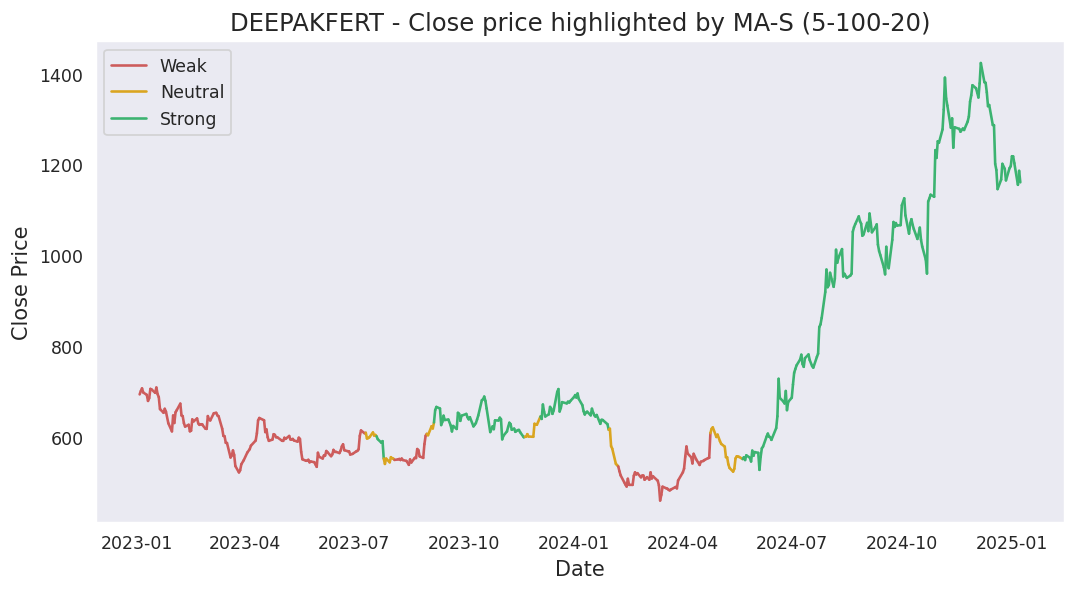
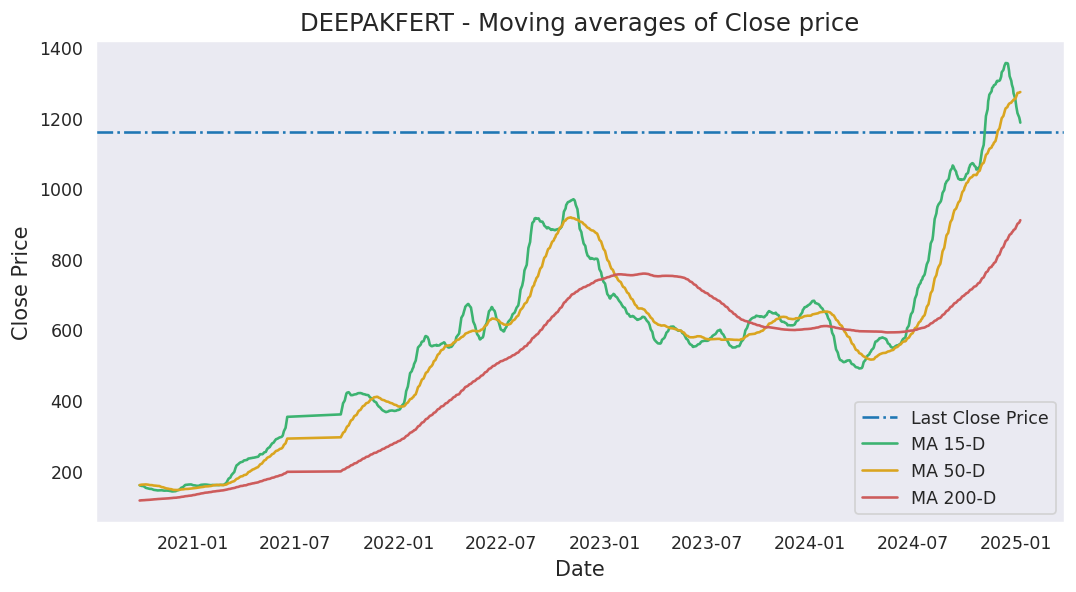
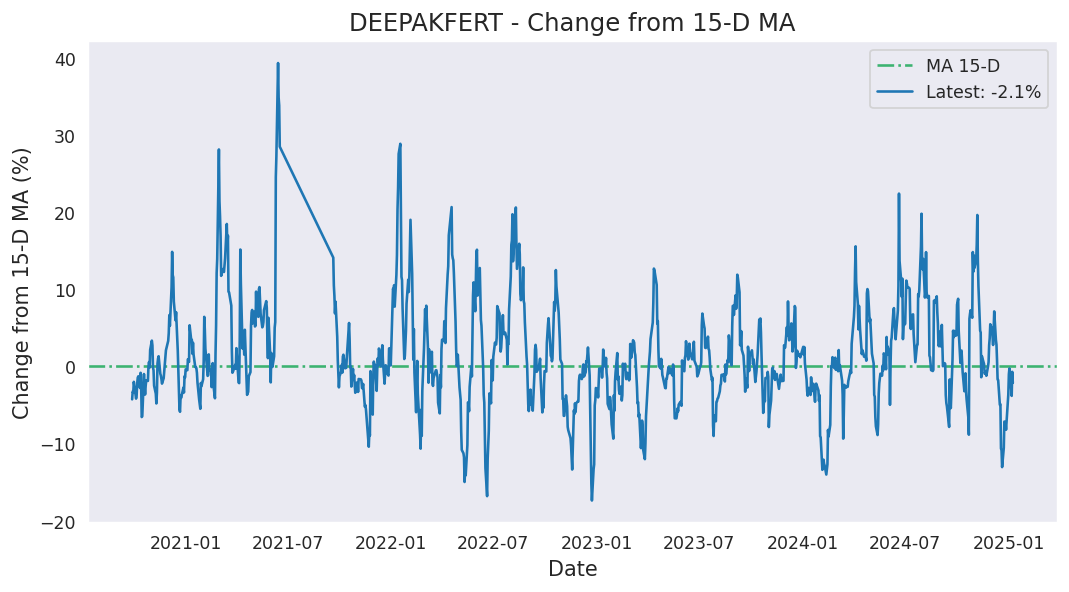
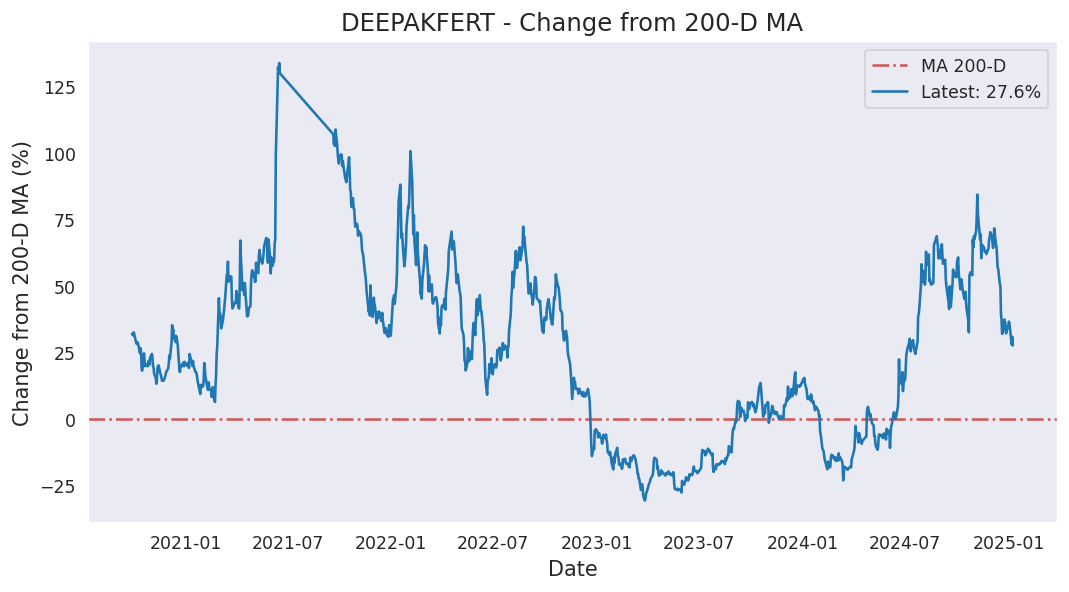
Moving averages
Last close price: 1563.3
Average of last 15 days: 1484.91
Average of last 50 days: 1337.04
Average of last 200 days: 1272.42
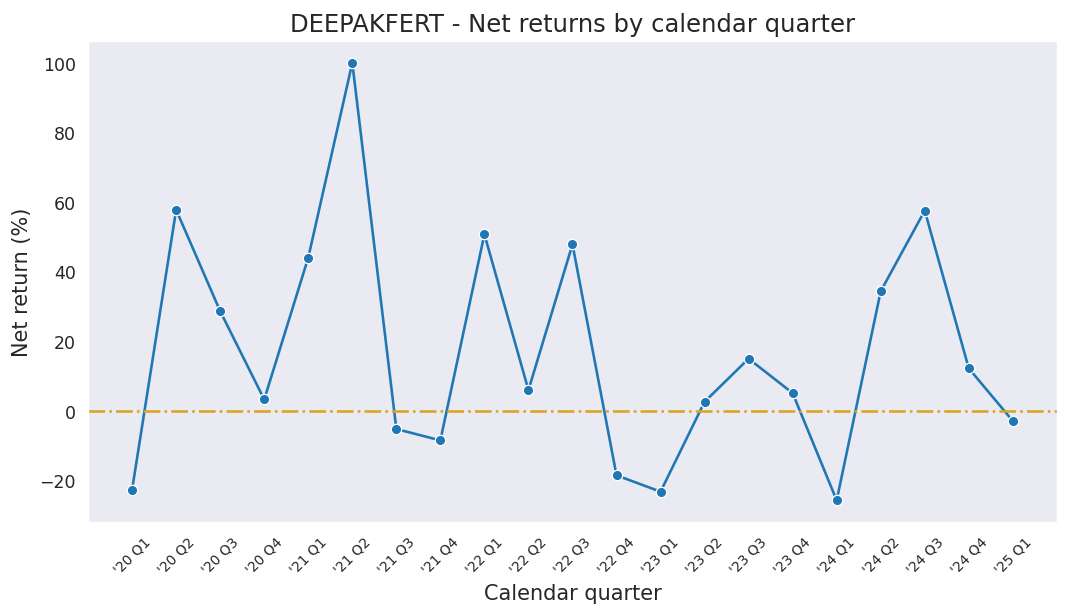
Analysis based on 1543 records from January 01, 2020 to June 19, 2026
Last updated on June 19, 2026
| 5 Days | 15 Days | 50 Days | 200 Days | 1000 Days | |
|---|---|---|---|---|---|
| Start Date | June 15, 2026 | June 01, 2026 | April 08, 2026 | August 28, 2025 | June 08, 2022 |
| Net Return | 0.56% | 10.86% | 58.75% | 7.54% | 120.95% |
| Average Daily Return | 0.112% | 0.690% | 0.929% | 0.036% | 0.079% |
| Median Close Price | 1535.00 | 1501.60 | 1318.15 | 1275.10 | 904.45 |
| Lowest Close Price | 1508.30 | 1405.70 | 1049.30 | 872.10 | 459.95 |
| Highest Close Price | 1563.30 | 1563.30 | 1563.30 | 1580.30 | 1743.50 |
| Mean Value Traded | 565.15M | 600.39M | 741.87M | 511.10M | 689.66M |
Last close price: 1563.3
Average of last 15 days: 1484.91
Average of last 50 days: 1337.04
Average of last 200 days: 1272.42
DEEPAKFERT first closed above its last close price on Wednesday, June 04, 2025 which was 380 days ago.
Since then, it has closed over this price 12.4% of times which is 32 trading days.
Previously, DEEPAKFERT closed above its last close price on Friday, October 03, 2025 which was 259 days ago.
Historically, this stock gave a non-positive return for a maximum period of 1321 days which was from August 10, 2022 to March 23, 2026.

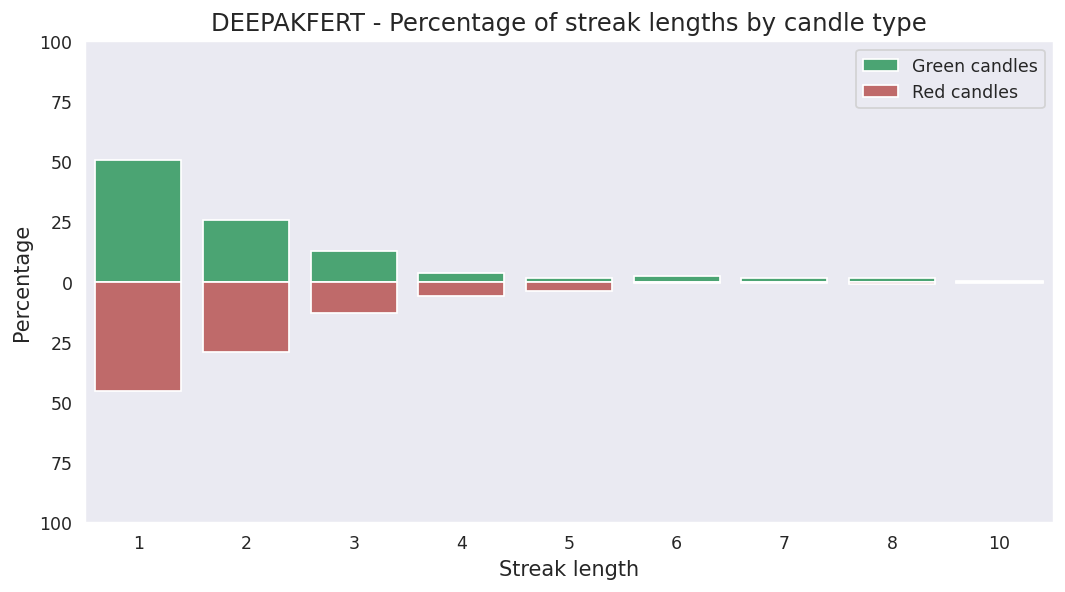
Last candle: Green (2.46%)
Overall percentage of Green candles: 49.1%
Current streak of Green candles: 1
Net change so far for the current streak: 2.46%
Probability of streak continuing: 49.0%
Longest streak of Green candles: 10 trading days from March 28, 2023 to April 13, 2023
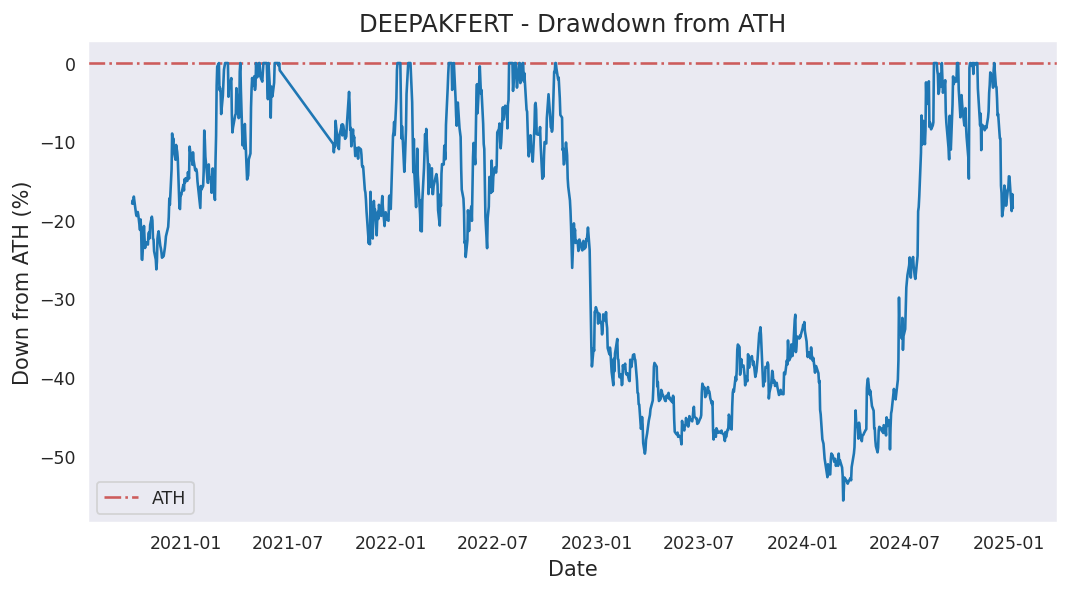
Current down from ATH: -10.34%
Most down from ATH: -55.69%
ATH hits in last 1000 days: 35
ATH was last hit on Tuesday, July 01, 2025.