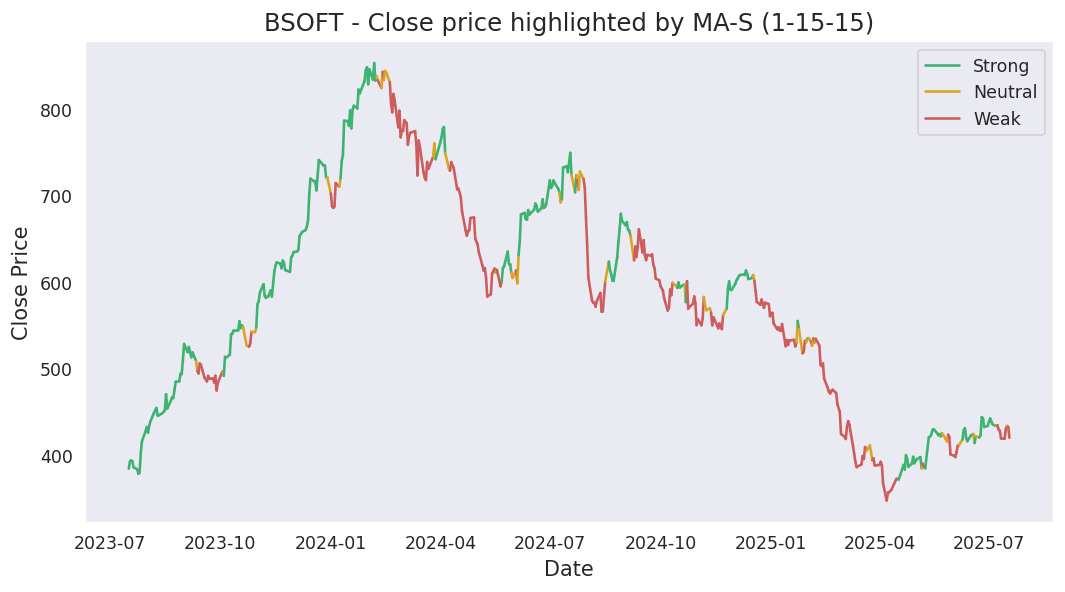
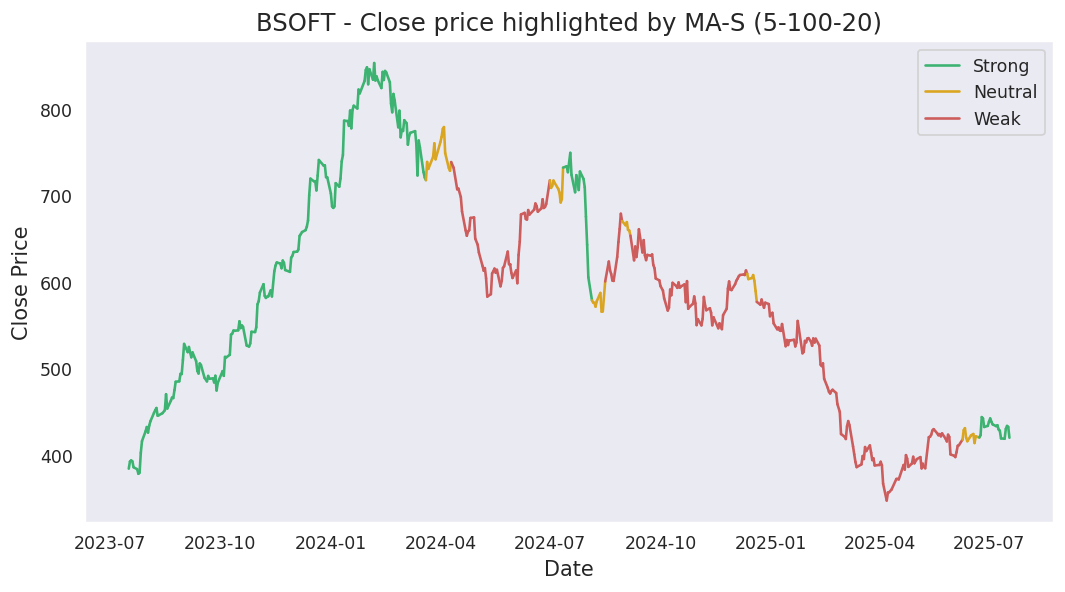
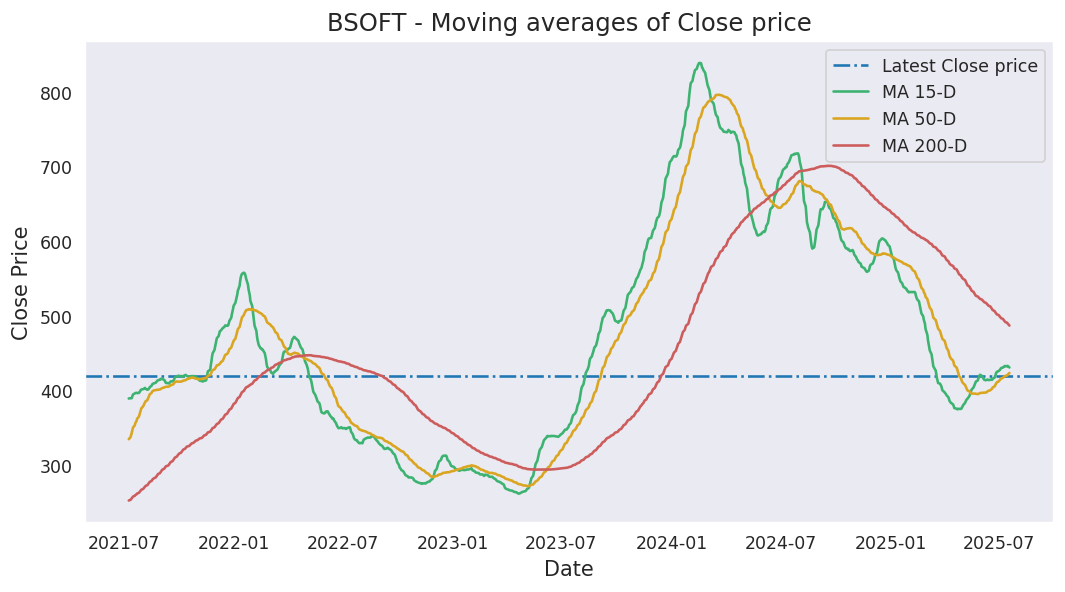
Moving averages
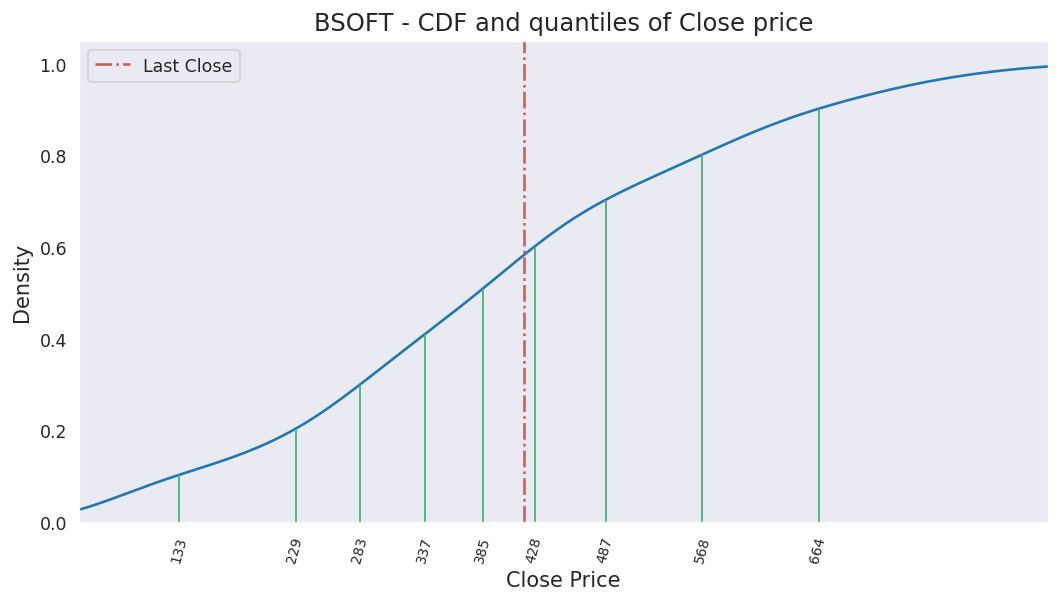
Last close price: 326.4
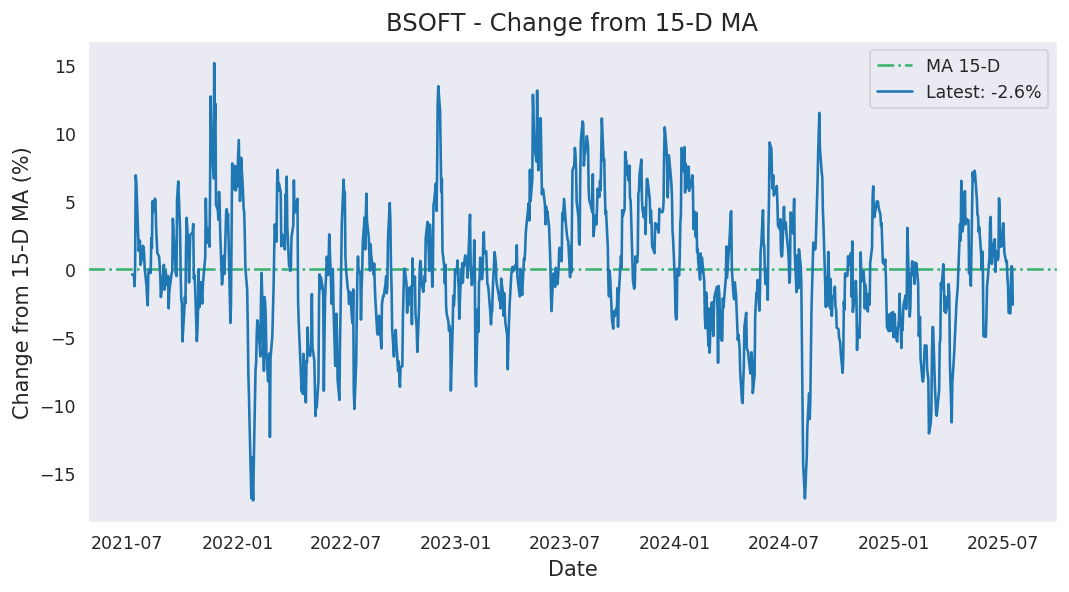
Average of last 15 days: 324.16
Average of last 50 days: 345.24
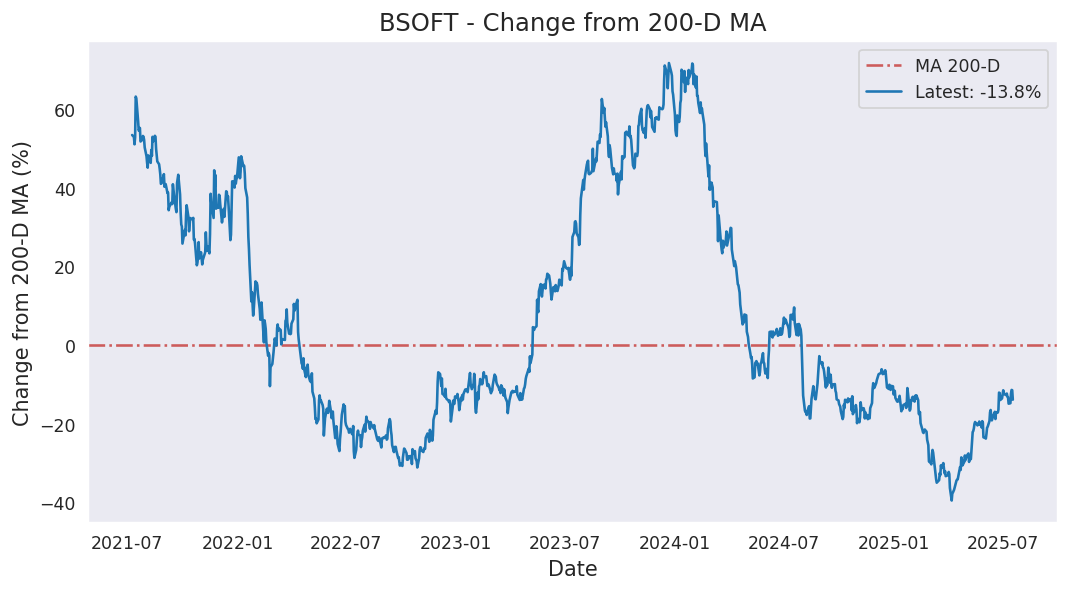
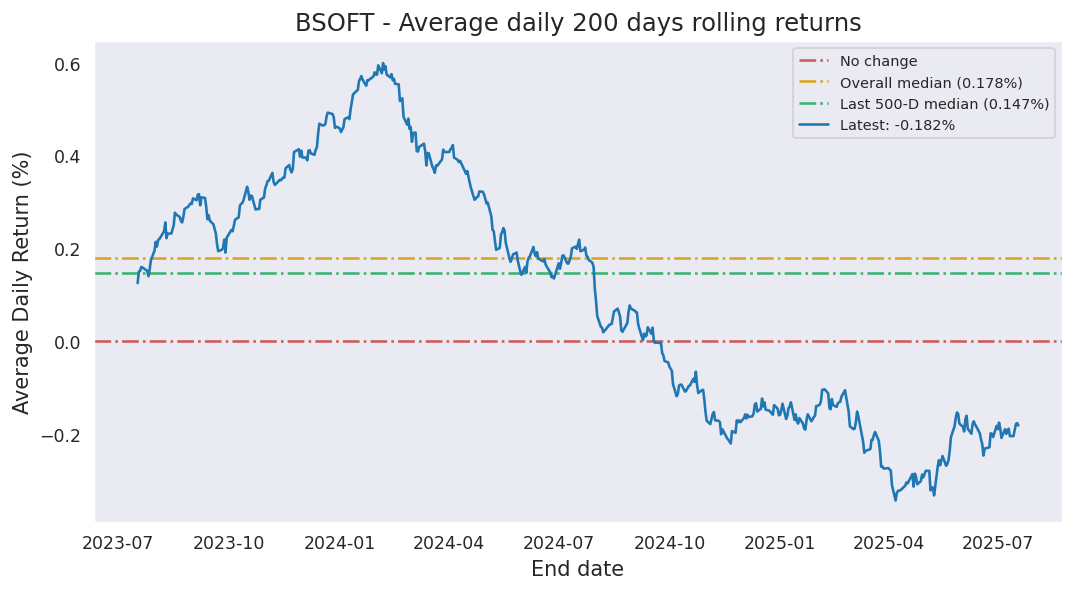
Average of last 200 days: 379.43
Analysis based on 1606 records from January 01, 2020 to June 19, 2026
Last updated on June 19, 2026
| 5 Days | 15 Days | 50 Days | 200 Days | 1000 Days | |
|---|---|---|---|---|---|
| Start Date | June 15, 2026 | June 01, 2026 | April 08, 2026 | August 28, 2025 | June 08, 2022 |
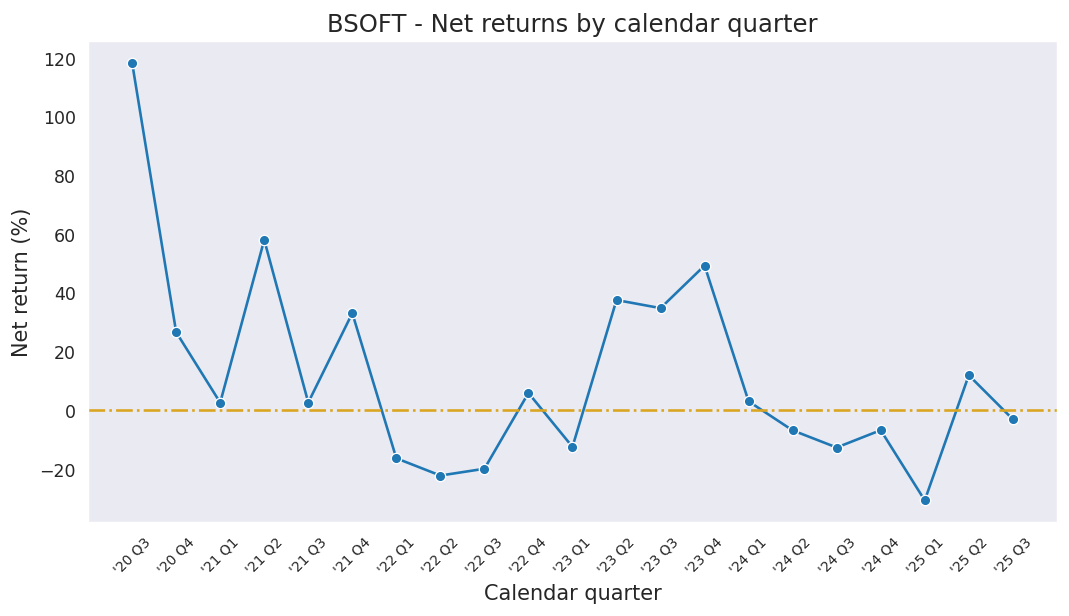
| Net Return | 3.29% | 2.21% | -11.26% | -11.69% | -9.68% |
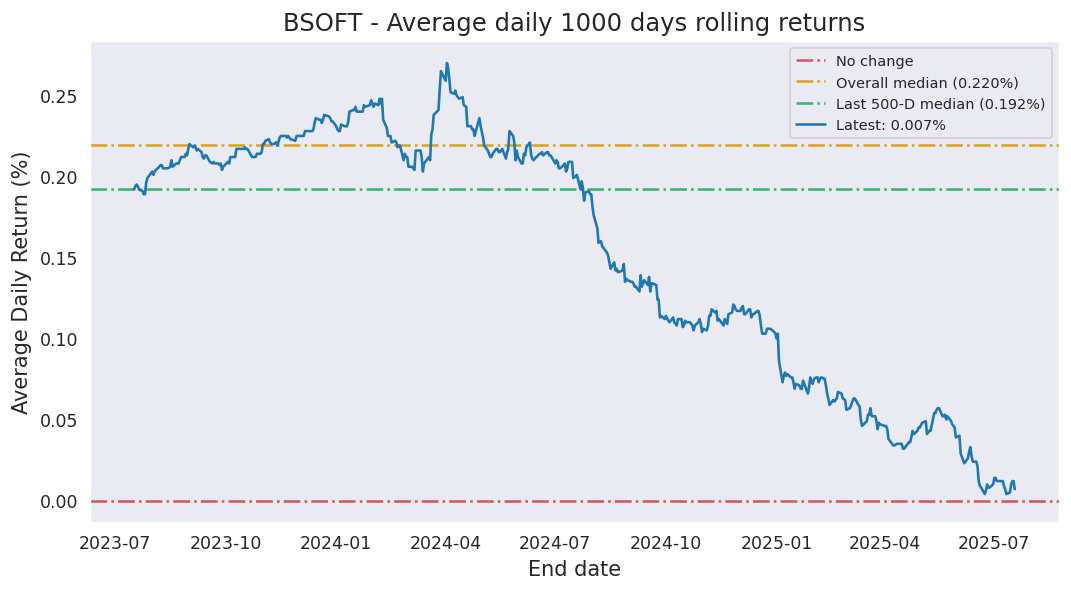
| Average Daily Return | 0.650% | 0.146% | -0.239% | -0.062% | -0.010% |
| Median Close Price | 324.25 | 324.25 | 329.50 | 376.10 | 406.52 |
| Lowest Close Price | 323.60 | 310.85 | 309.60 | 309.60 | 251.75 |
| Highest Close Price | 326.40 | 344.80 | 394.40 | 465.50 | 853.40 |
| Mean Value Traded | 306.03M | 583.85M | 441.38M | 604.67M | 1.06B |
Last close price: 326.4
Average of last 15 days: 324.16
Average of last 50 days: 345.24
Average of last 200 days: 379.43
BSOFT first closed above its last close price on Thursday, May 27, 2021 which was 1849 days ago.
Since then, it has closed over this price 83.6% of times which is 1051 trading days.
Previously, BSOFT closed above its last close price on Friday, June 05, 2026 which was 14 days ago.
Historically, this stock gave a non-positive return for a maximum period of 1849 days which was from May 27, 2021 to June 19, 2026.
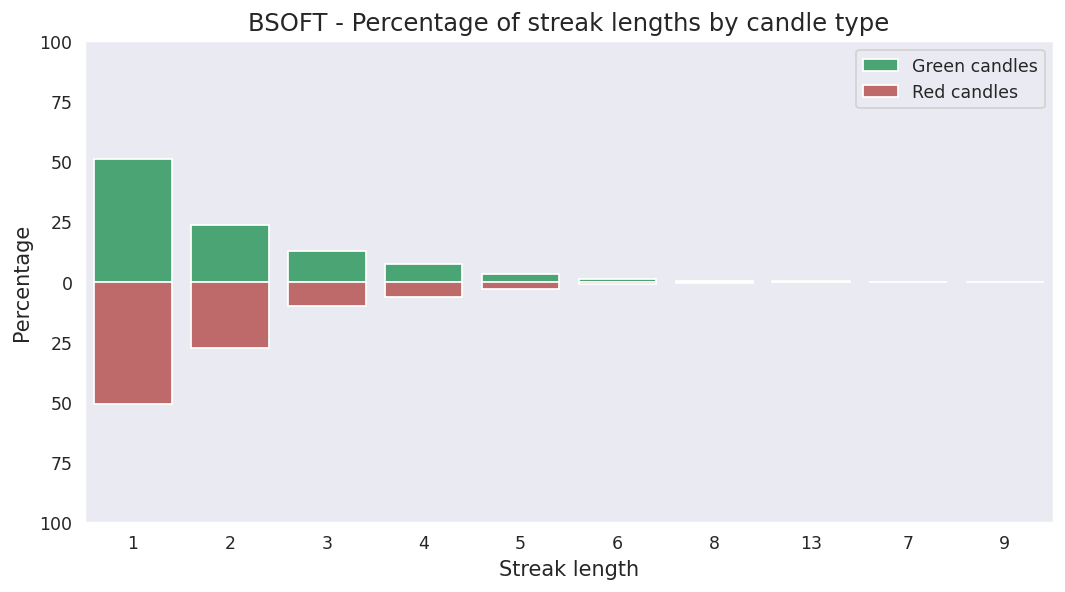
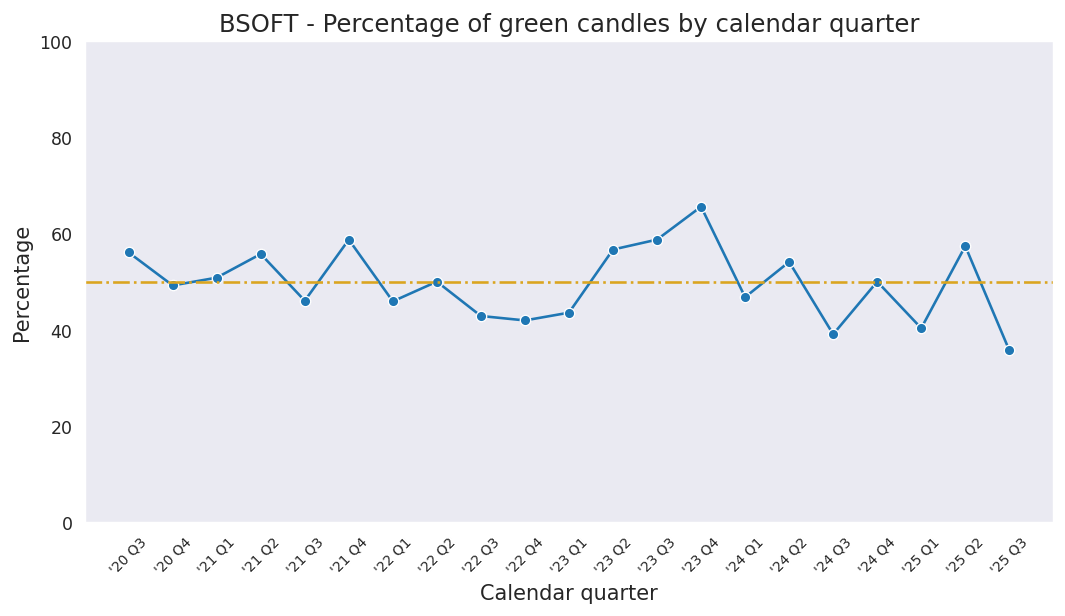
Last candle: Green (0.38%)
Overall percentage of Green candles: 50.0%
Current streak of Green candles: 2
Net change so far for the current streak: 0.87%
Probability of streak continuing: 51.2%
Longest streak of Green candles: 13 trading days from November 29, 2023 to December 15, 2023
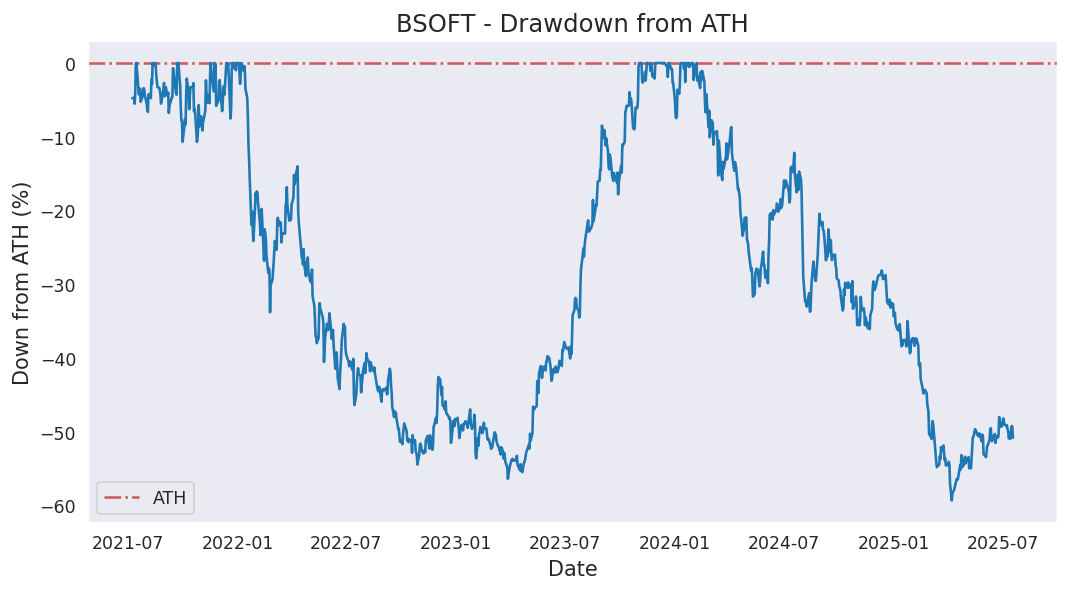
Current down from ATH: -61.75%
Most down from ATH: -63.72%
ATH hits in last 1000 days: 32
ATH was last hit on Tuesday, February 06, 2024.