Moving averages
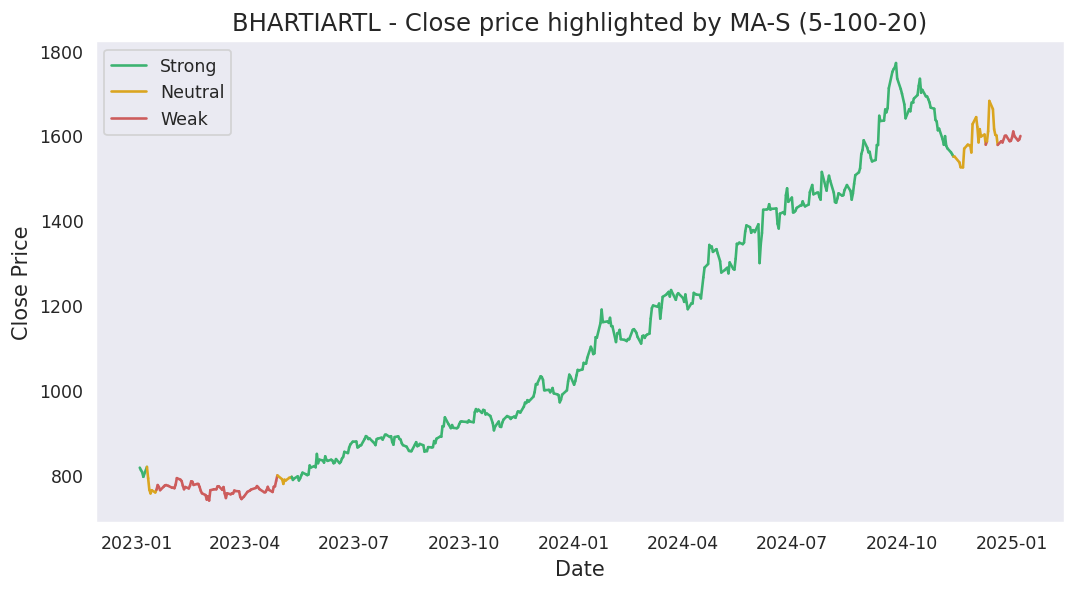
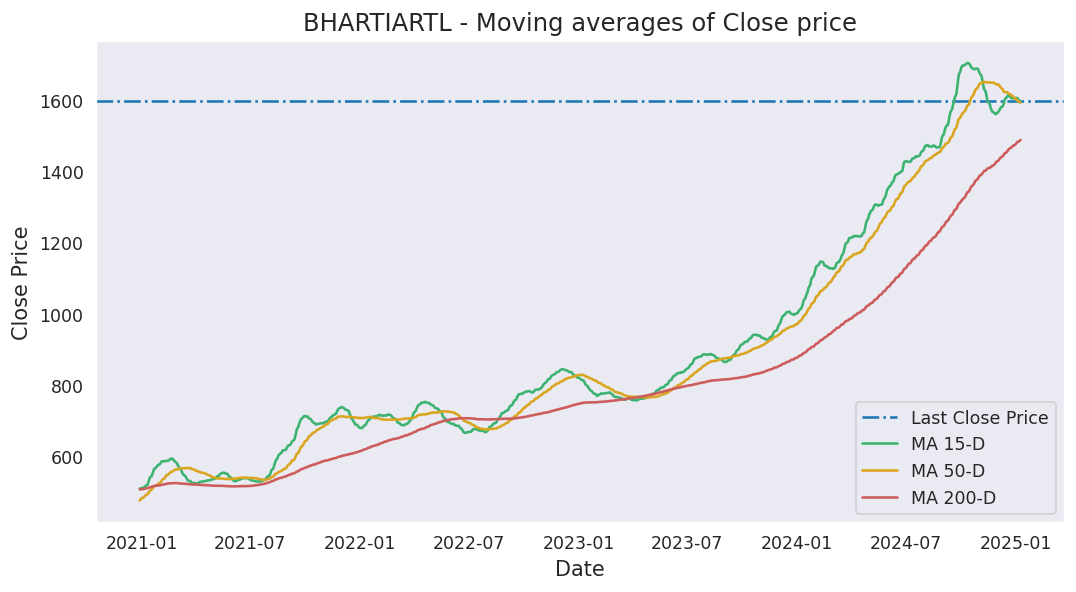
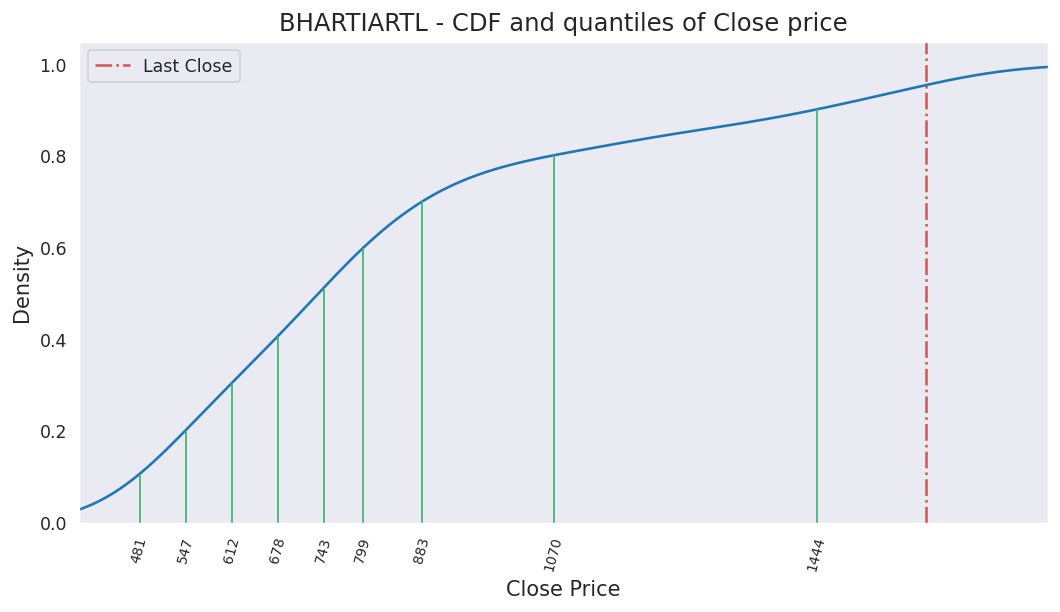
Last close price: 1910.8
Average of last 15 days: 1827.61
Average of last 50 days: 1843.65
Average of last 200 days: 1951.86
Analysis based on 1606 records from January 01, 2020 to June 19, 2026
Last updated on June 19, 2026
| 5 Days | 15 Days | 50 Days | 200 Days | 1000 Days | |
|---|---|---|---|---|---|
| Start Date | June 15, 2026 | June 01, 2026 | April 08, 2026 | August 28, 2025 | June 08, 2022 |
| Net Return | 4.84% | 4.47% | 4.40% | 0.32% | 178.83% |
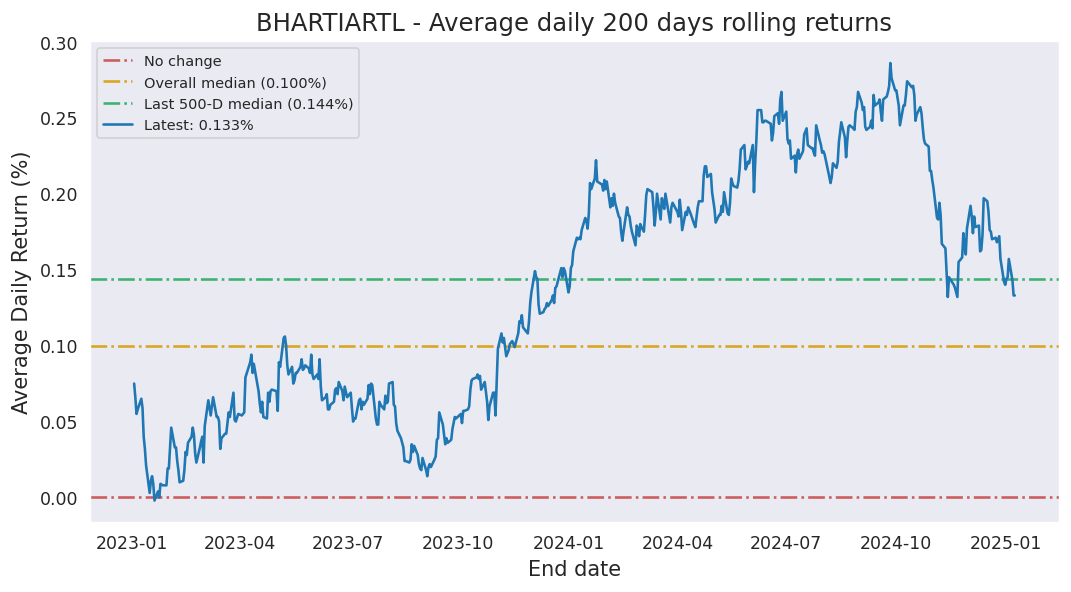
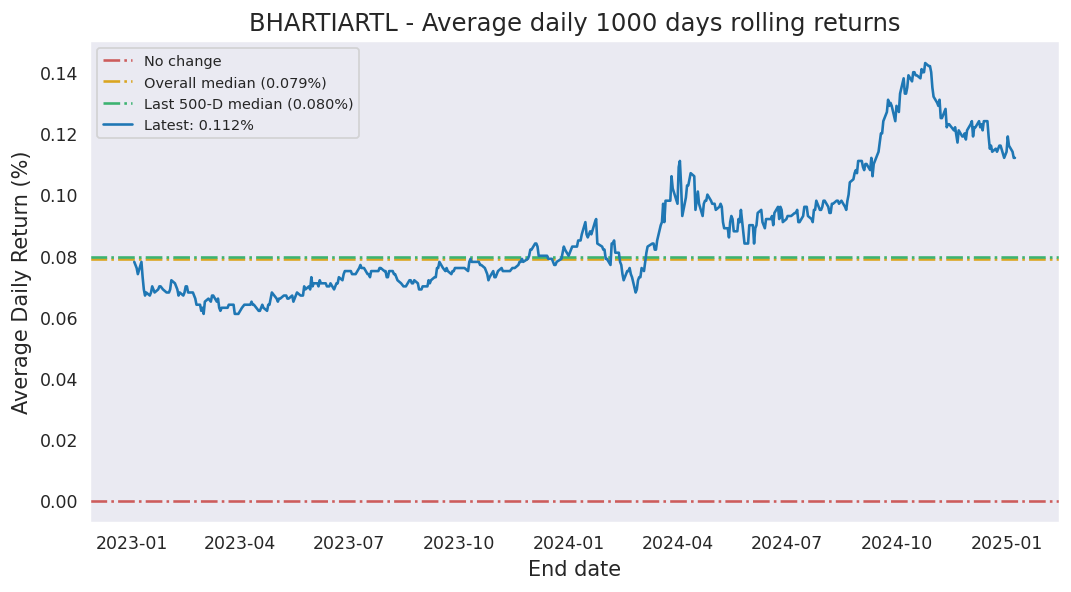
| Average Daily Return | 0.951% | 0.292% | 0.086% | 0.002% | 0.103% |
| Median Close Price | 1874.80 | 1818.90 | 1842.50 | 1939.70 | 1417.50 |
| Lowest Close Price | 1841.20 | 1775.20 | 1756.80 | 1756.80 | 640.90 |
| Highest Close Price | 1910.80 | 1910.80 | 1938.10 | 2162.70 | 2162.70 |
| Mean Value Traded | 14.67B | 13.23B | 17.84B | 15.15B | 9.22B |
Last close price: 1910.8
Average of last 15 days: 1827.61
Average of last 50 days: 1843.65
Average of last 200 days: 1951.86
BHARTIARTL first closed above its last close price on Friday, June 20, 2025 which was 364 days ago.
Since then, it has closed over this price 59.1% of times which is 146 trading days.
Previously, BHARTIARTL closed above its last close price on Tuesday, May 19, 2026 which was 31 days ago.
Historically, this stock gave a non-positive return for a maximum period of 594 days which was from September 25, 2024 to May 12, 2026.
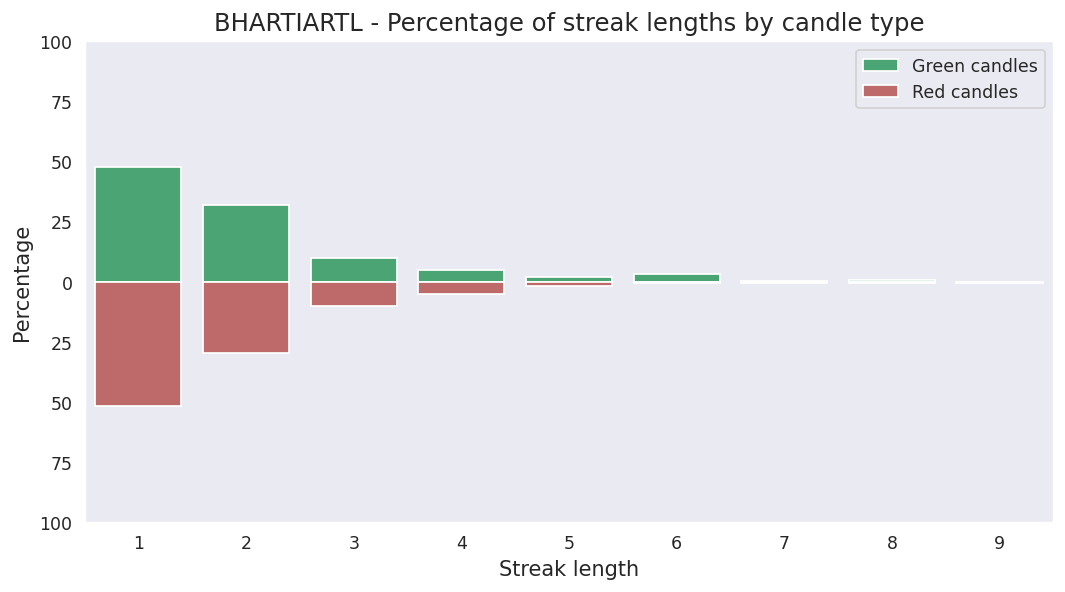
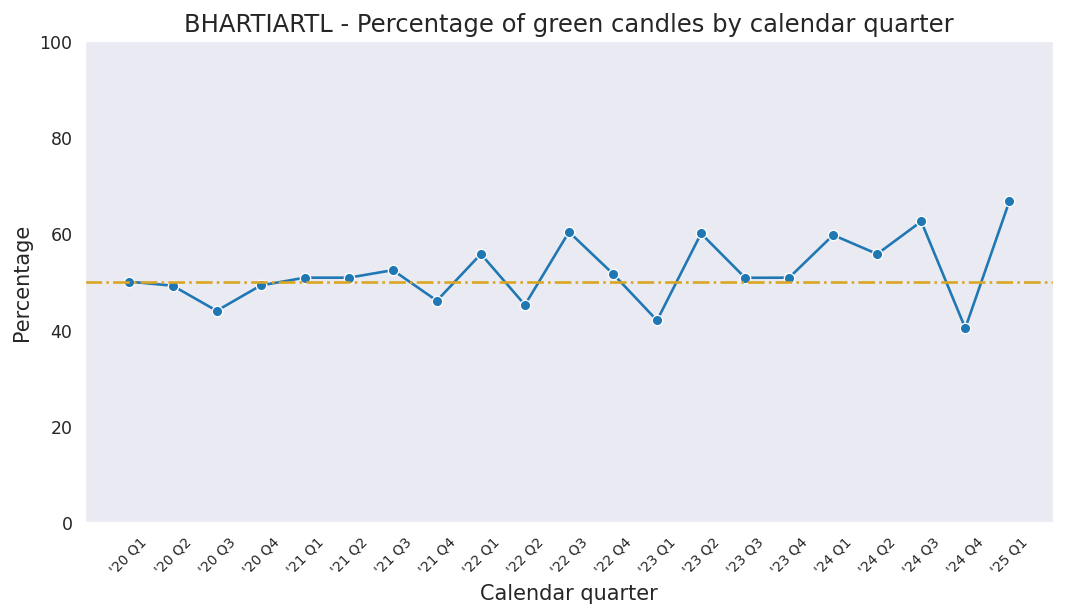
Last candle: Green (1.92%)
Overall percentage of Green candles: 51.6%
Current streak of Green candles: 1
Net change so far for the current streak: 1.92%
Probability of streak continuing: 51.7%
Longest streak of Green candles: 8 trading days from November 10, 2025 to November 19, 2025
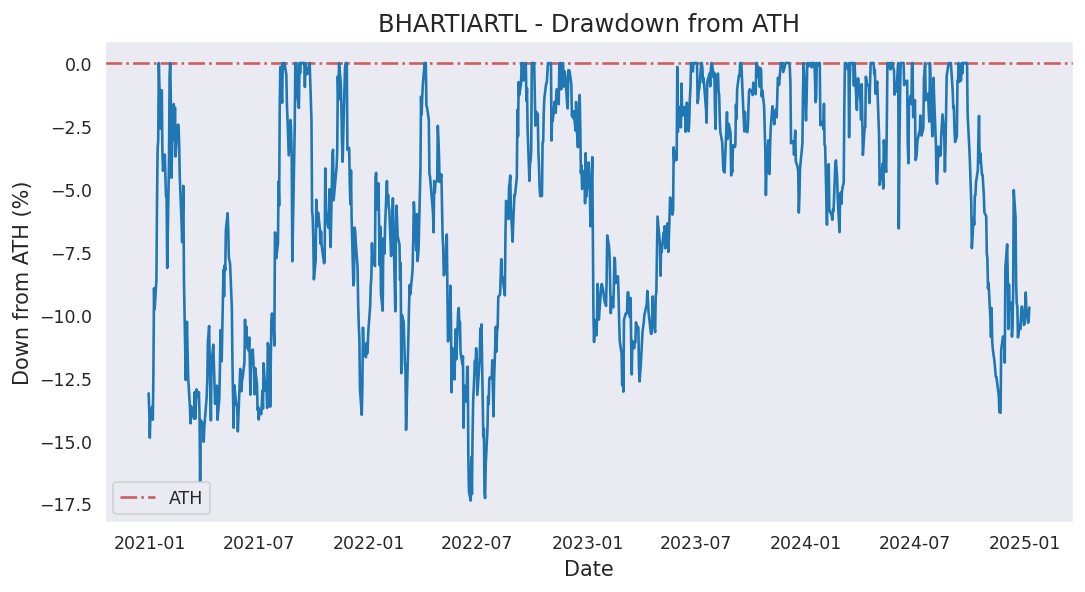
Current down from ATH: -11.65%
Most down from ATH: -33.58%
ATH hits in last 1000 days: 97
ATH was last hit on Friday, November 21, 2025.