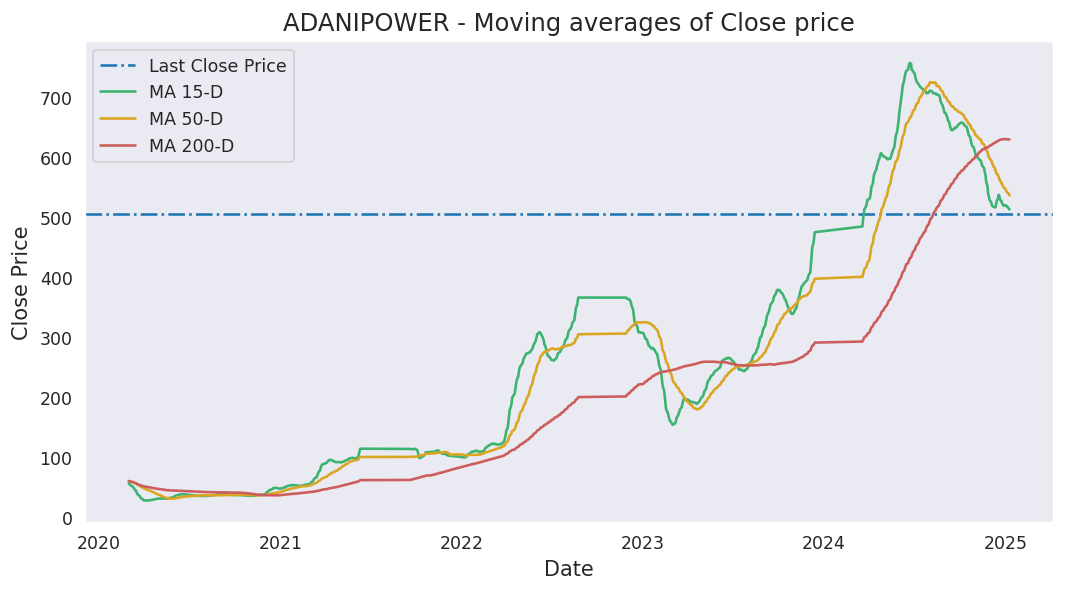
Moving averages
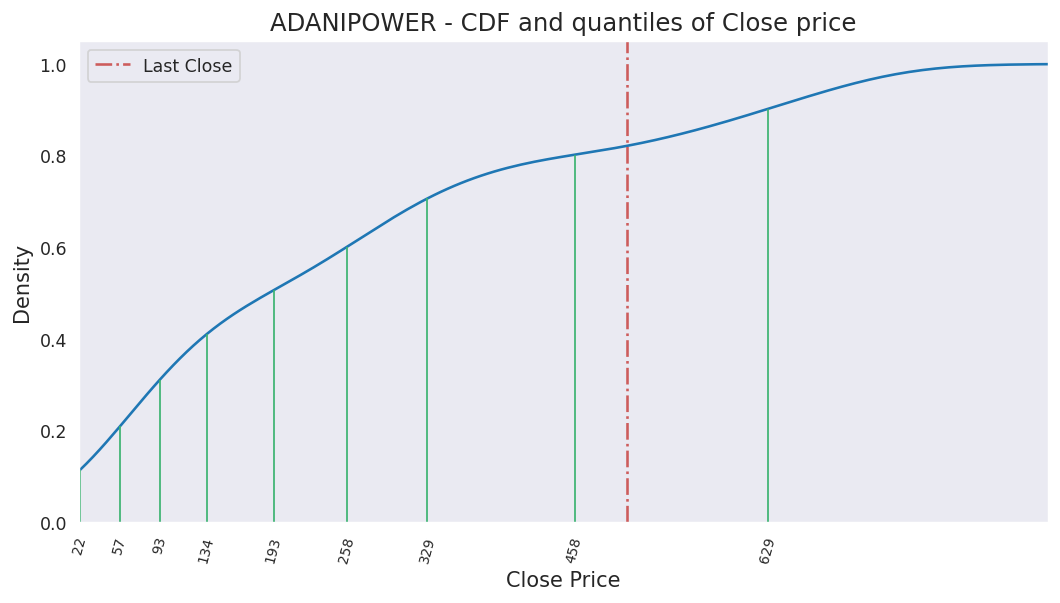
Last close price: 231.76
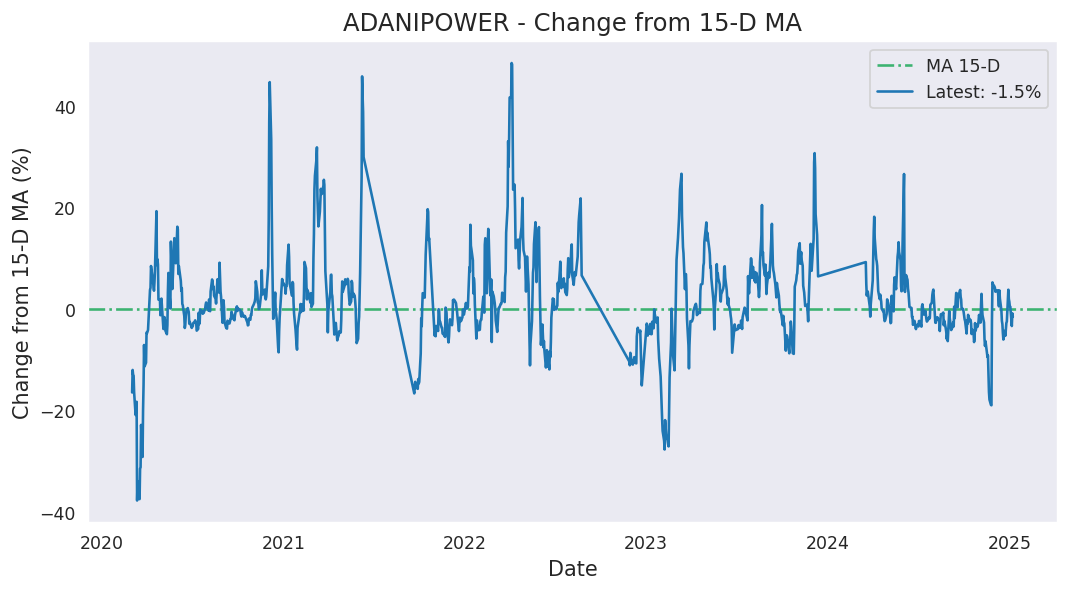
Average of last 15 days: 226.69
Average of last 50 days: 218.08
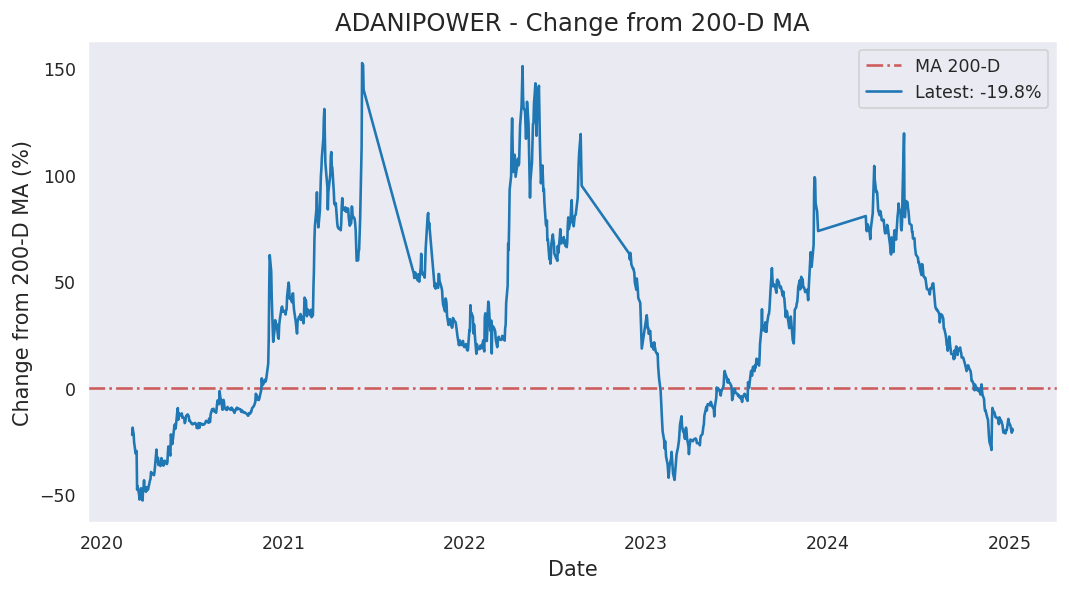
Average of last 200 days: 163.69
Analysis based on 1400 records from January 01, 2020 to June 19, 2026
Last updated on June 19, 2026
| 5 Days | 15 Days | 50 Days | 200 Days | 1000 Days | |
|---|---|---|---|---|---|
| Start Date | June 15, 2026 | June 01, 2026 | April 08, 2026 | August 28, 2025 | November 25, 2021 |
| Net Return | 3.90% | -4.77% | 41.87% | 95.71% | 994.24% |
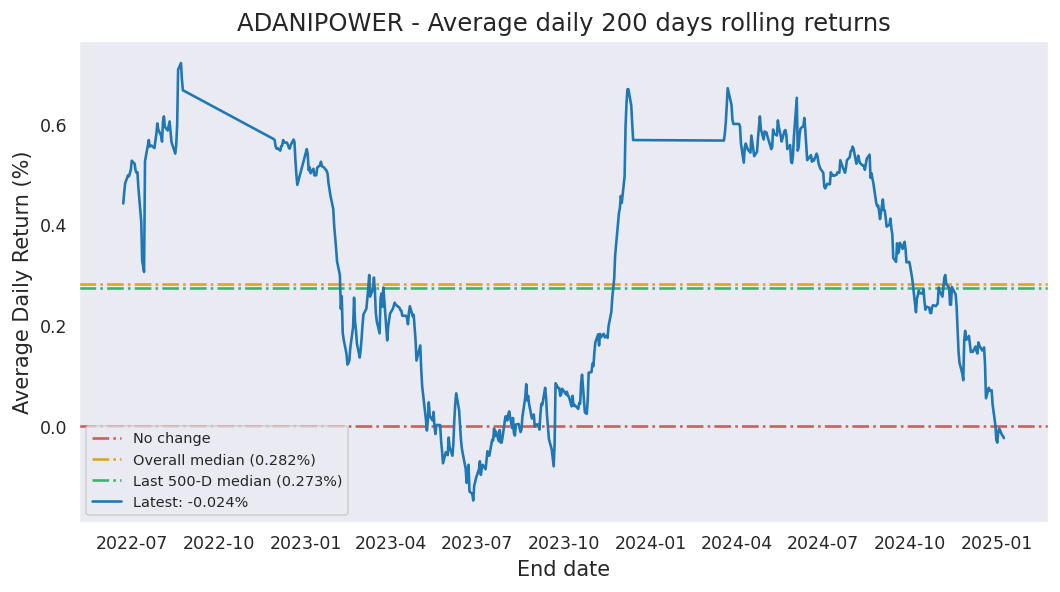
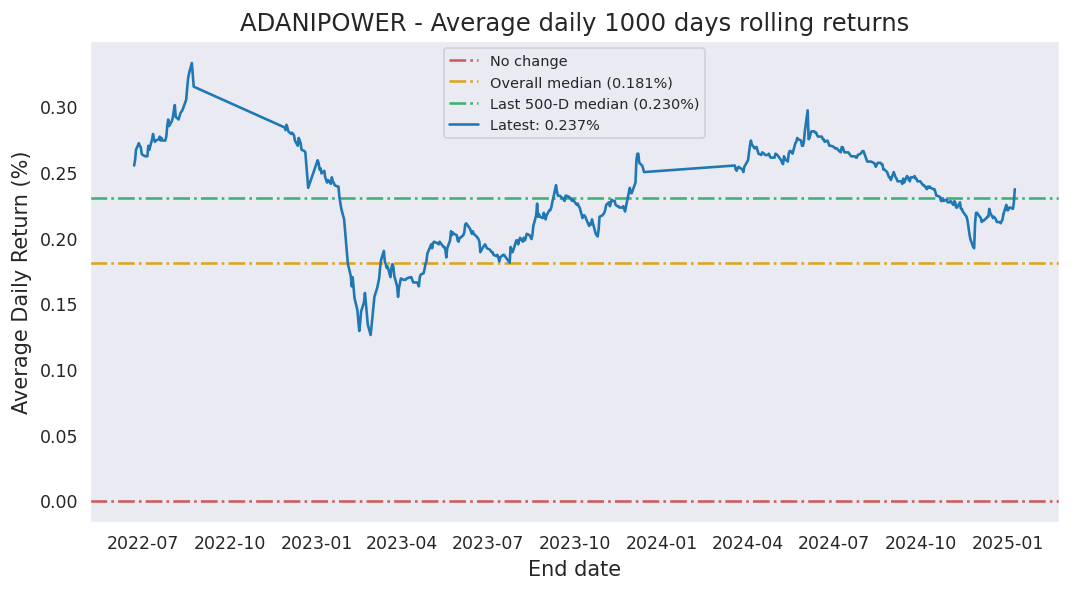
| Average Daily Return | 0.767% | -0.325% | 0.702% | 0.336% | 0.240% |
| Median Close Price | 222.60 | 226.14 | 220.96 | 149.75 | 103.52 |
| Lowest Close Price | 220.40 | 215.51 | 169.31 | 118.99 | 19.42 |
| Highest Close Price | 231.76 | 235.93 | 248.91 | 248.91 | 248.91 |
| Mean Value Traded | 7.80B | 7.26B | 10.64B | 6.73B | 4.57B |
Last close price: 231.76
Average of last 15 days: 226.69
Average of last 50 days: 218.08
Average of last 200 days: 163.69
ADANIPOWER first closed above its last close price on Monday, May 25, 2026 which was 25 days ago.
Since then, it has closed over this price 47.4% of times which is 9 trading days.
Previously, ADANIPOWER closed above its last close price on Friday, June 05, 2026 which was 14 days ago.
Historically, this stock gave a non-positive return for a maximum period of 675 days which was from June 03, 2024 to April 09, 2026.
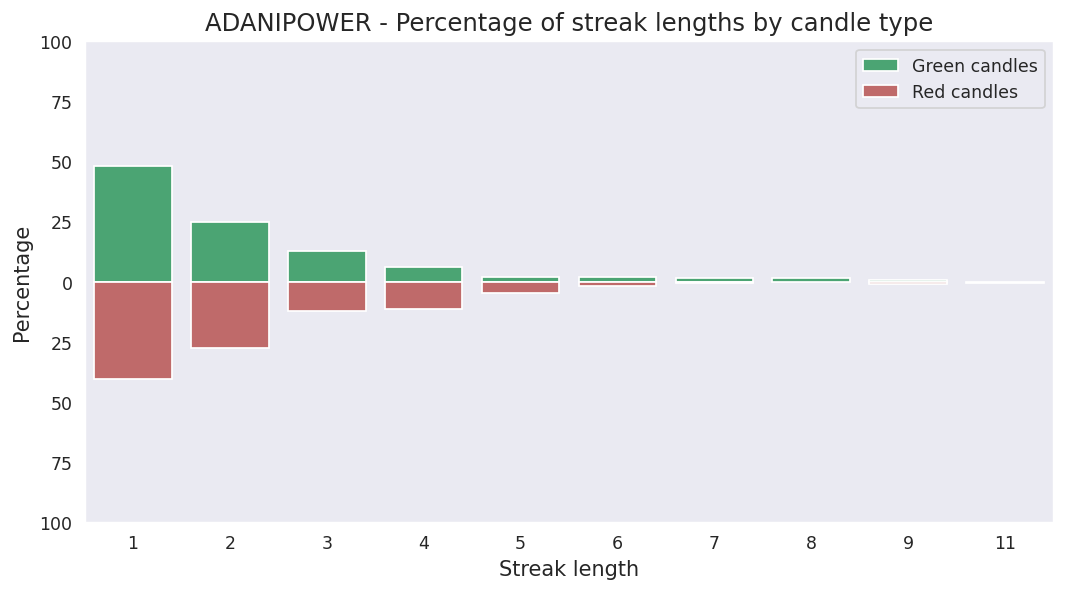
Last candle: Green (0.52%)
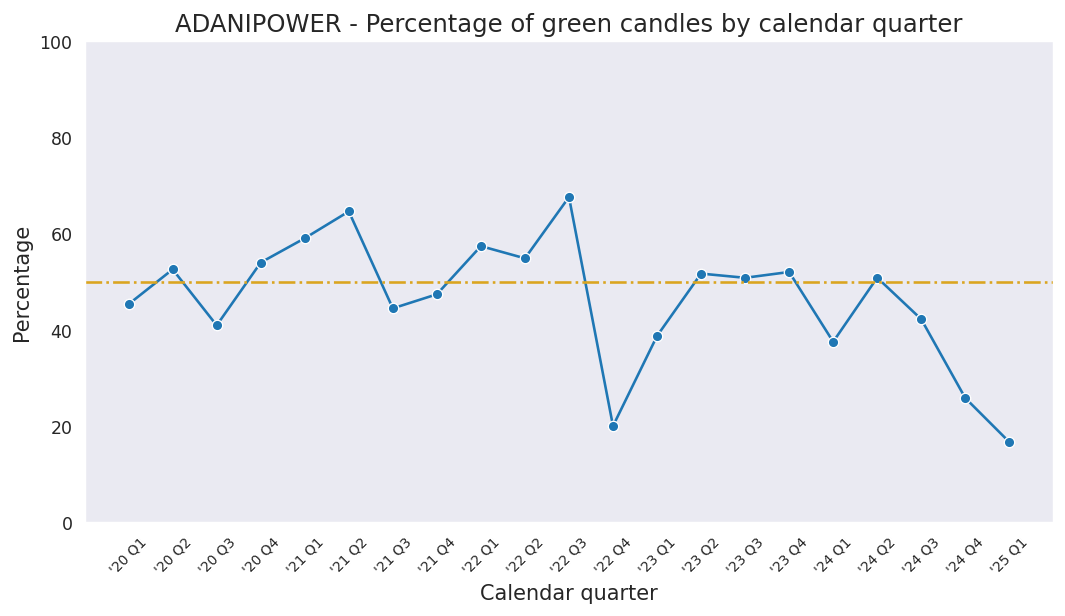
Overall percentage of Green candles: 48.9%
Current streak of Green candles: 2
Net change so far for the current streak: 5.15%
Probability of streak continuing: 53.1%
Longest streak of Green candles: 14 trading days from April 01, 2026 to April 22, 2026
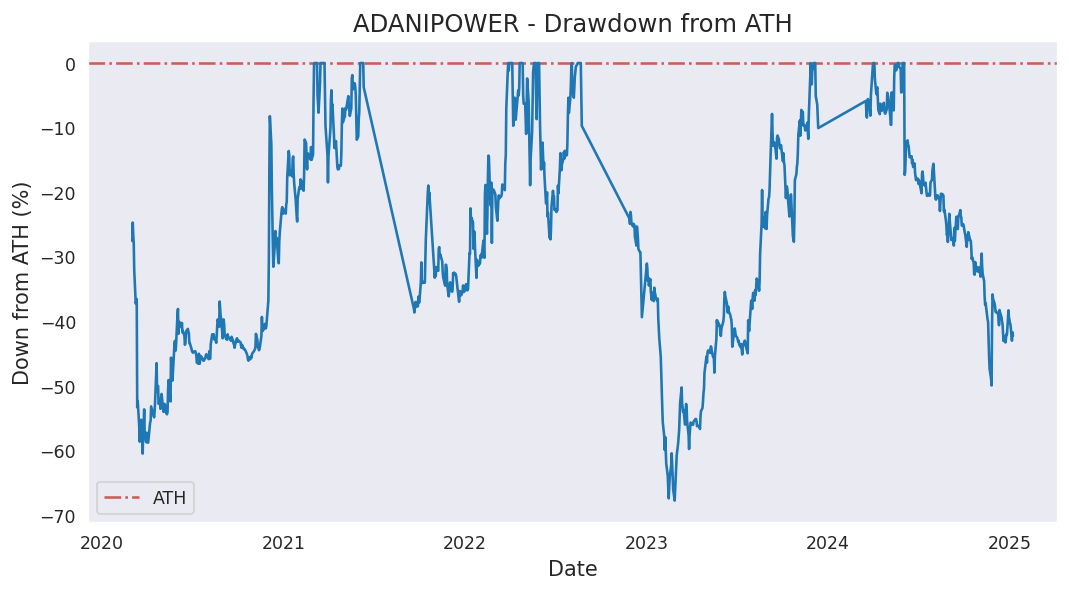
Current down from ATH: -6.89%
Most down from ATH: -67.78%
ATH hits in last 1000 days: 50
ATH was last hit on Wednesday, May 27, 2026.